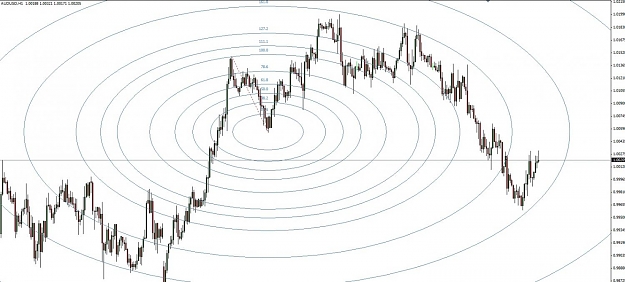
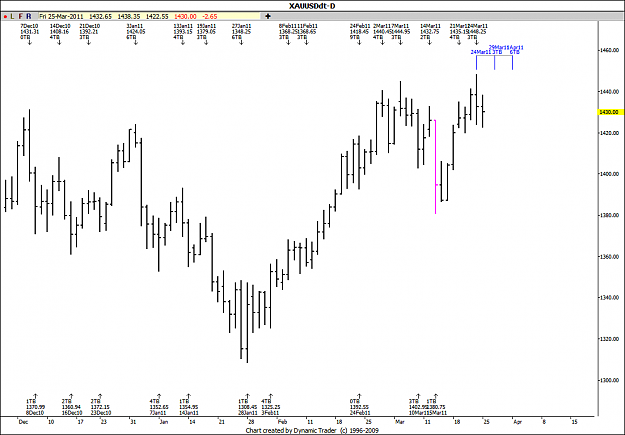
Amazing how price responds when it arrives at one of the arcs. Each spot on the chart represents TIME and price. I think it would be an interesting project to catalog the time when price changes with each swing in a trend. Any pair should do (with good volume) and larger time-frames will probably be easier to work with. Not volunteering for the project...just a thought. It may yield an interesting time pattern  .
.
Enjoy the weekend,
FX4Newbies
Enjoy the weekend,
FX4Newbies
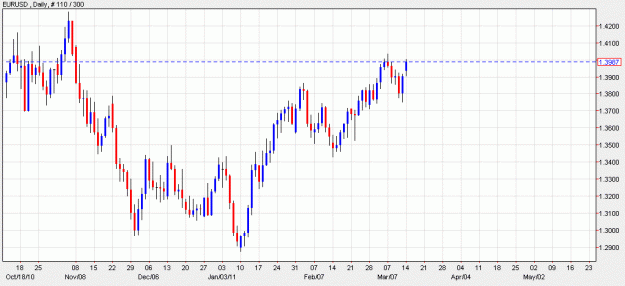
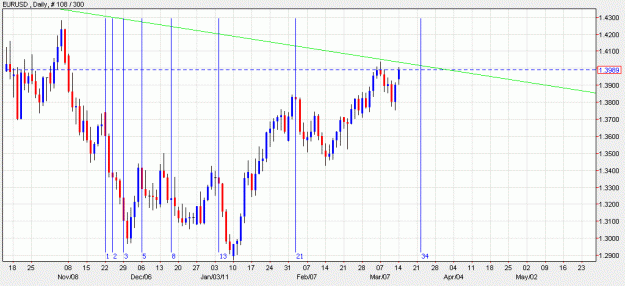
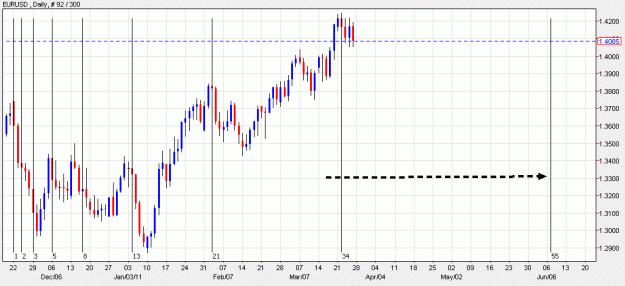
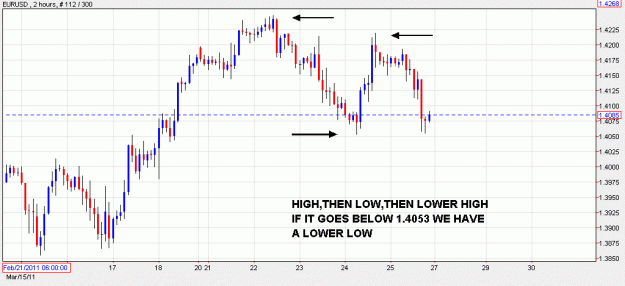
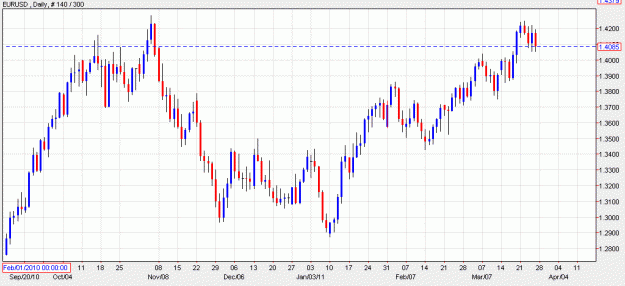
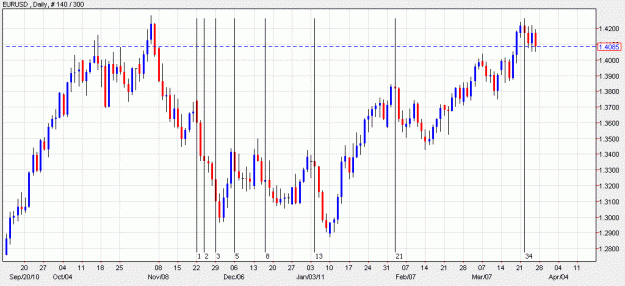
Attached Image (click to enlarge)