Rambling to you, nuggets of wisdom to the rest of us.
With a valid test in the correct place, are you concerned about the volume or, are you happy as long as it isn't very high - ultra high?
Ignored
Is this a trick question .
If it is a pure test then I like low volume (less than the previous two). But a test on increasing volume that has a small range like NR4 is still good. Especially if it is a selling bar/candle. Which means it is making a lower low and not a lower high. And then if it is also lower than the candle before the previous candle/bar-the candle/bar two candles back.
If it is a KRB (not VSA since VSA does not look at the open) I don't mind if the volume is a bit higher. The strength of the bar/candle is still evident because of the close being in the upper portion of the range after the candle dips into lower ground. "good" or "bullish" volume is increasing volume on up bars/candles. Not to complicate it a bit, but then the range of the KRB matters. If it is narrow like on increased volume it is also a squat. A sign of stregnth in its own right.
And of course, high volume is always a concern.
Wyckoff VSA: (1) Supply & Demand (2) Effort vs. Result (3) Cause & Effect
If it is a pure test then I like low volume (less than the previous two). But a test on increasing volume that has a small range like NR4 is still good. Especially if it is a selling bar/candle. Which means it is making a lower low and not a lower high. And then if it is also lower than the candle before the previous candle/bar-the candle/bar two candles back.
If it is a KRB (not VSA since VSA does not look at the open) I don't mind if the volume is a bit higher. The strength of the bar/candle is still evident because...
Ignored
Thanks for that.
It wasn't a trick question. My interest was 'pricked' when you said that 'it was a high volume test' and you didn't mind. I normally associate you with technically correct, high quality setups. You don't normally 'make do' with stuff!
Goto go now I'll post a chart of what I see on EU H1 Later.
Ignored
Just got home from work, checking the charts and was quite pleased about getting the EU direction right when I realised I hadn't posted the chart last night. Sorry guys.
Of course it's much easier to post it now I KNOW I'm right
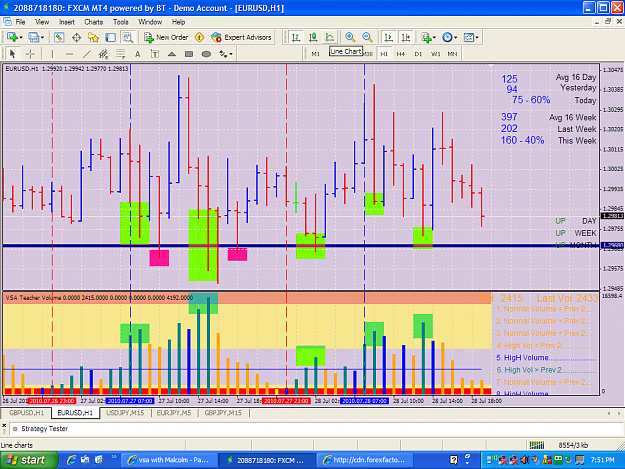
I see higher volumes at the lower end of the range which indicates buying to me. However MTM says that during Accumulation, we should see lower volumes at the bottom of the range and higher volumes at the top. He qualifies this by saying that the volume is due to SM selling into the herd in order to stop the price from increasing against their own buying.
I'd be interested to know what you guys think about accumulation in a forex market.
EDIT :- Not sure why the volumes were low during the magenta boxes.
Just got home from work, checking the charts and was quite pleased about getting the EU direction right when I realised I hadn't posted the chart last night. Sorry guys.
Of course it's much easier to post it now I KNOW I'm right
I see higher volumes at the lower end of the range which indicates buying to me. However MTM says that during Accumulation, we should see lower volumes at the bottom of the range and higher volumes at the top. He qualifies this by saying that the volume is due to SM selling into the herd in order to stop the price...
Ignored
This was confusing to me for a while as there are different things said about identifying accumulation or distribution. All I can say is that I've basically found what you have, that when higher volumes appear at the lows in a range (or a trend for that matter), it's being bought, and vice versa.
One of my "pre-trade" activities at the start of the day is to look at where the high volume is. Usually can determine a direction by seeing if there's more volume coming in at the peaks (selling) or at the valleys (buying). Not sure if this is the "right" way or not, but I can say it has yielded good results re. calling the bias long or short for the day/session...my 2 cents
This was confusing to me for a while as there are different things said about identifying accumulation or distribution. All I can say is that I've basically found what you have, that when higher volumes appear at the lows in a range (or a trend for that matter), it's being bought, and vice versa.
One of my "pre-trade" activities at the start of the day is to look at where the high volume is. Usually can determine a direction by seeing if there's more volume coming in at the peaks (selling) or at the valleys (buying). Not sure if this is the...
Ignored
Thanks TC....interesting.
I'm not confused about what I find. But I am confused about why it differs from what Tom says.
In the past I have found Tom to be wrong on some things in his teaching. However, as my understanding of VSA increases, I have realised that Tom was indeed correct and it was me who had it wrong. But with accumulation, the evidence is right there in front of us. I appear to be correct.
I find myself in the rather odd situation of wanting to be wrong. Because if I'm right Tom must be wrong. If he is wrong about this, he could be wrong about other things also, and I dont want to believe this.
I would like it very much if any of you could put me right on this.
Nice posts HG. Well I have to say that this week has been the most frustrating to trade that I can recently remember. Horrible price action on the majors that I watch. This week is usually the peak of the summer holiday season and I hope that this factored in.
The Eur is creeping up to that 1.3100 level, I missed an reverse upthrust on the 5 and the 15min chart that I cant believe. o well, the markets will be here tommorrow.
Ignored
not just the majors ..es to ... drop 20 points then almost close where it opened .. nice ganes being played this week for sure.
I may be out of the markets till back end of August till it all settles down... why burn your self out to make 50 % profitable trades at best with this whipsaw bs action ? even vsa on a 15 min does not work this week
Just got home from work, checking the charts and was quite pleased about getting the EU direction right when I realised I hadn't posted the chart last night. Sorry guys.
Of course it's much easier to post it now I KNOW I'm right
I see higher volumes at the lower end of the range which indicates buying to me. However MTM says that during Accumulation, we should see lower volumes at the bottom of the range and higher volumes at the top. He qualifies this by saying that the volume is due to SM selling into the herd in order to stop the price...
Just because I don't post much does not mean I am not watching the thread a lot. Some very, very valid stuff being discussed here.
My background is the junior market. Owning public companies and owning 80% of the shares outstanding. And believe you me, accumulation was a significant part of our strategy when we trying to elevate our stock price or try to get to a better exchange, which required a much higher stock price.
And I too, noticed today, the interesting buying dips of the US related currencies.
But the missing maraschino cherry on the top for me, that would indicate for sure that the US dollar is going to go down the drain, is the lack of media pandering about how strong the US dollar is.
What made me a small fortune was the media telling everyone how the Euro was going to hell. That was a sure fire sign that the EURO was the buy of the year.
For all the indicators out there and sentiment readings the mainstream media is there for one thing, distribution.
And where are they for my final assessment?
Honestly, it would be a great indicator to add for you guys. It is invaluable for me. Probably because my family is huge in it and I saw at a young age how despicable that sector is.
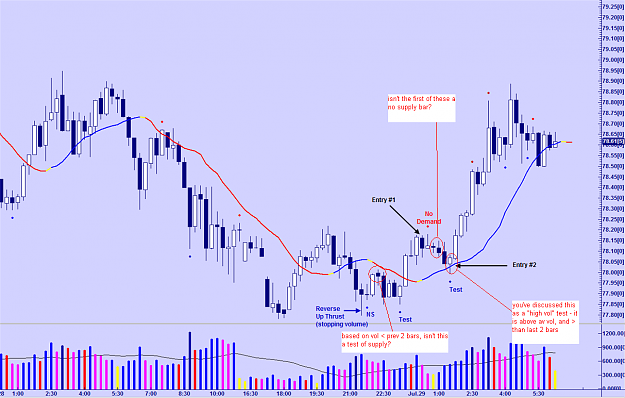
The best place to take your trade is shown on the chart below. The candle marked entry #2 is ideal because:
1. It is a test (a high volume test, but a test none the less).
2. Price makes a lower low than the previous bar and dips below the Balance Point Line but closes above it. The movement down and then the rejection back up is a sign of bullishness.
3. In this case the Balance Point Line is essentially acting as a support line.
I put in Entry #1 because some traders would take it. I do not like it however and I will tell you why....
Ignored
HG, I'm a big fan of your posts, but I have to say this one has really confused me. I read your chart completely differently to you, based on what I thought were the bar definitions *you* are using for testing. I personal would have entered after the first test that I marked on your chart (despite the next bar being down perhaps invalidating the test - but you don't see that until after the fact), with stop loss below the low of the stopping volume for a profitable trade, but I'm very curious about your reads on the tests here as I respect your judgement and explanations.
I've marked your chart up with my reading, and a couple of questions and queries around the bars. The first two bars I've circled seem liked valid tests and therefore confirmation to enter after evidence of strength in the background. Could you take the time to answer these and list your bar/volume definitions for no supply, test of supply and hidden test indicating if and how they are different from those outlined in master the markets? It seems that you are refining your definitions to include NR4 and recent low of the last 3 candles, which are also factors I've been considering recently, so I'd be keen to hear how they fit into your bar identification.
And in our area, LOW volume was a big indicator of accumulation, quiet time, where we would instruct the brokers or market makers to buy everything at .65 cents that comes their way. Eventually the selling would dry up with that tactic. Sometimes you had to "kick" the tree to get some apples to fall off.
Same tactics are applied here I would imagine. A sudden BIG sell of a currency pairing that is in profit to elicit a panic of selling to get MORE.
The volume on the KRB in this case is less than the previous two candles and less than average. In VSA terms it is a Hidden Test. Again note the action is around the Dynamic Balance Point Line, which is acting as support.
Now check out the Test. While it does not have a low lower than the last two candles, its range is at least less than the previous three candles. Making it at least a NR4.
Now look at the No Supply after the low volume shake out. Certainly not a narrow range. But not that it does have...
Good Morning to you sir, you mentioned squat here, isn't a downbar squat sign of strength and upbar squat sign of weakness? Whereas for KRB, we see a upbar (not buying bar) for strength ? Hope i remember them correctly, been working hard at reading the posts! haha.
If it is a pure test then I like low volume (less than the previous two). But a test on increasing volume that has a small range like NR4 is still good. Especially if it is a selling bar/candle. Which means it is making a lower low and not a lower high. And then if it is also lower than the candle before the previous candle/bar-the candle/bar two candles back.
If it is a KRB (not VSA since VSA does not look at the open) I don't mind if the volume is a bit higher. The strength of the bar/candle is still evident because...
whats RSX for? hmmm can't seem to google a gd explanation and how to use, will you be elaborating on it? I know you used to use it, i tested it out but was lost....is it like macd?