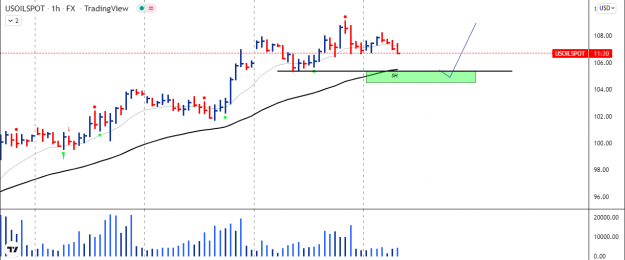
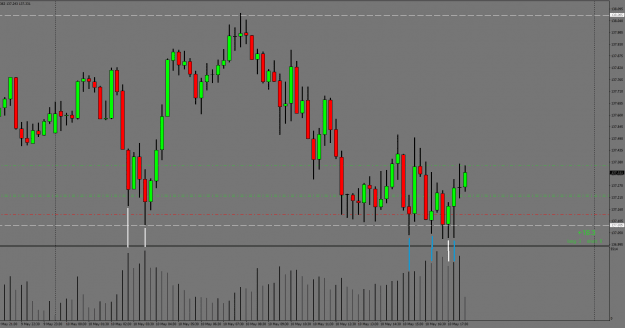
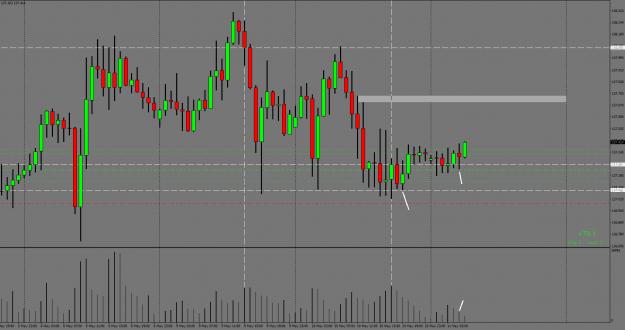
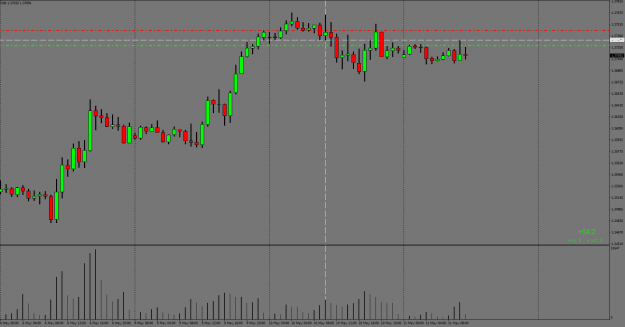
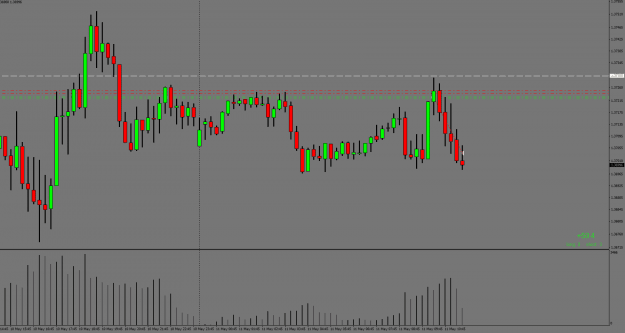
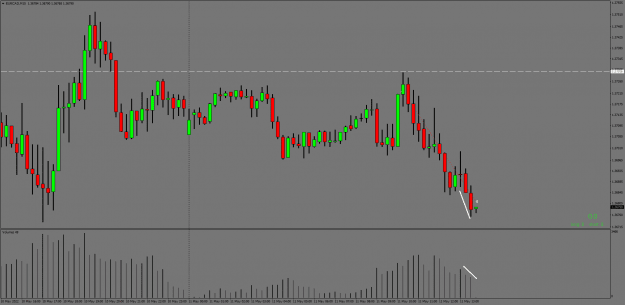
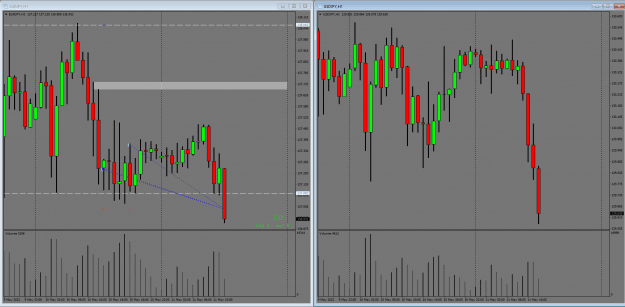
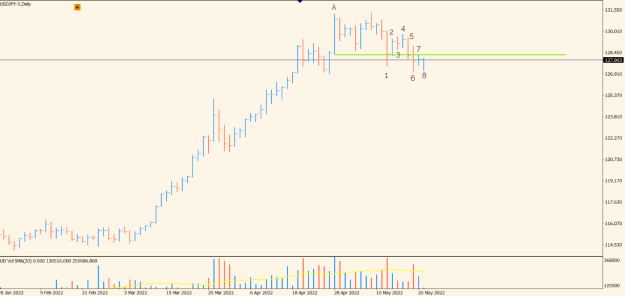
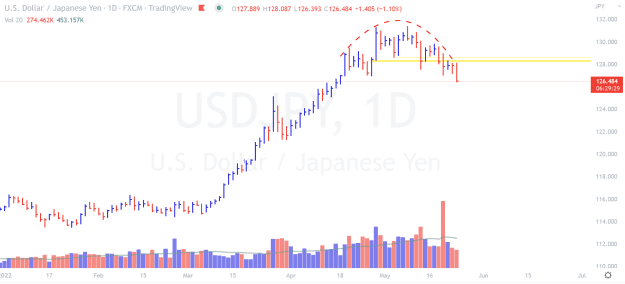
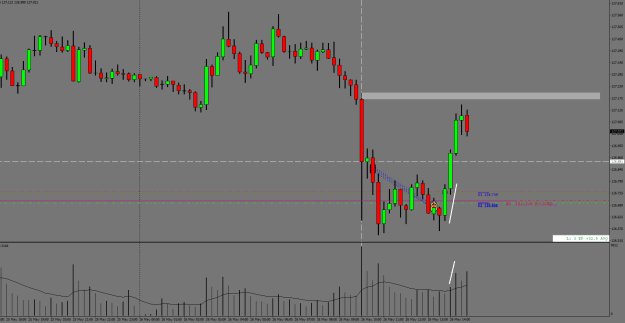
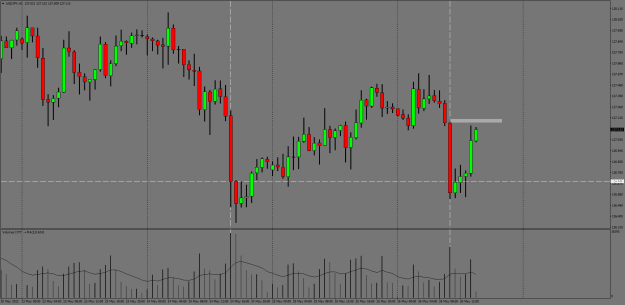
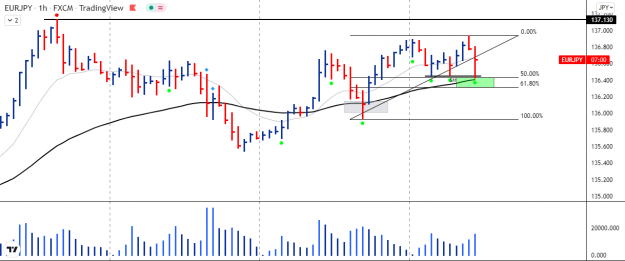
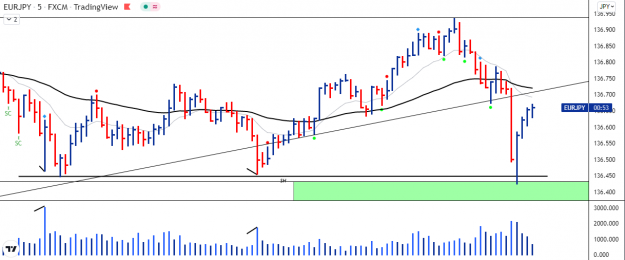
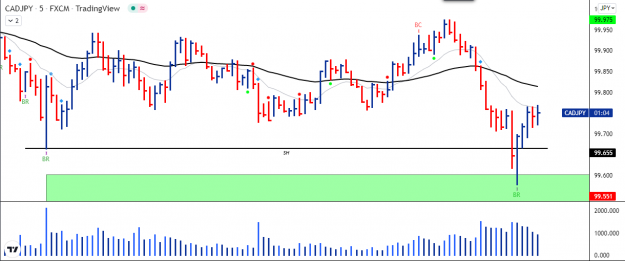
EJ looking to go long on 5m, same UJ and CJ. short NU
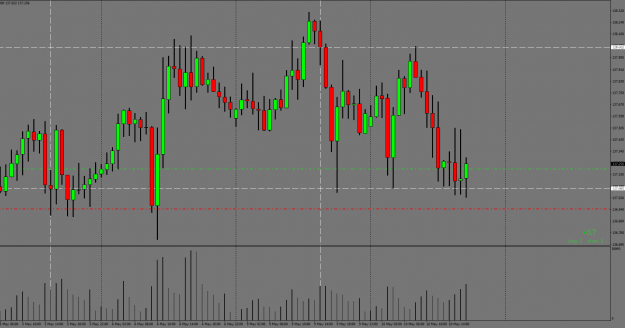
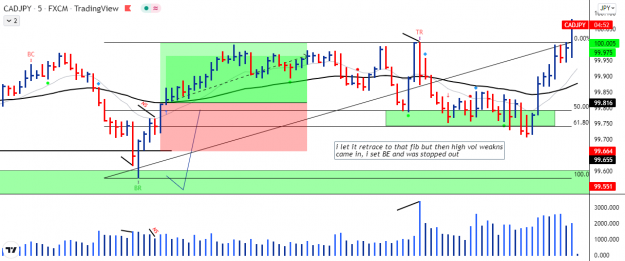
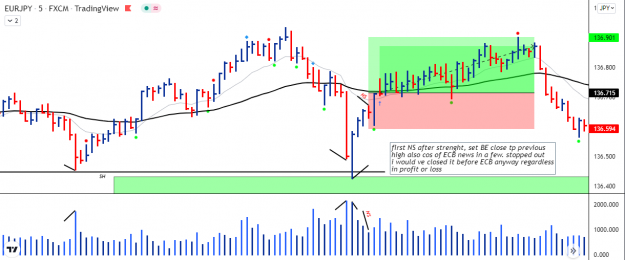
UPDATE> EJ BE hit..CJ BE hit after weakness came in
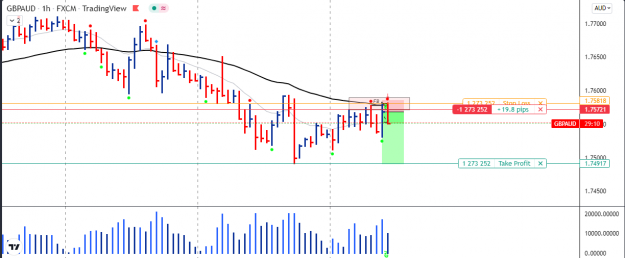
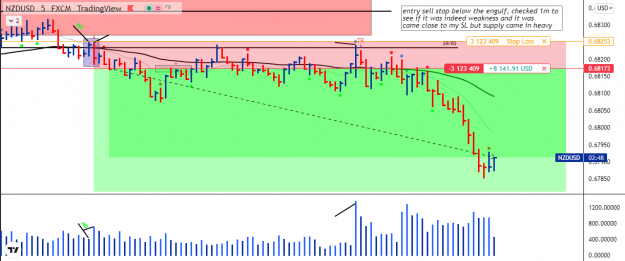
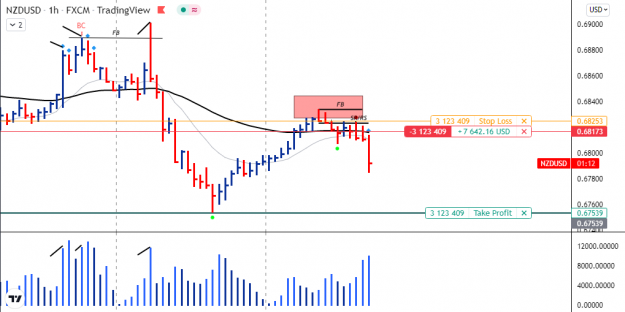
> NU almost stopped me out but heavy supply came in, still running
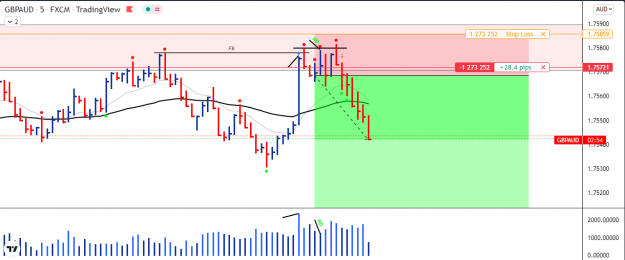
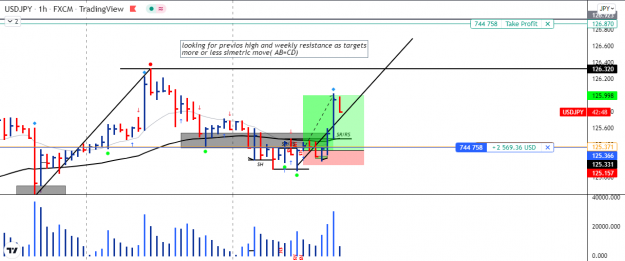
> UJ more strenght came in and it s marking price up, BE set, trade running
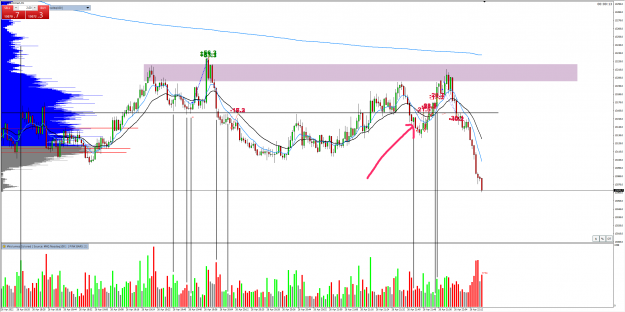
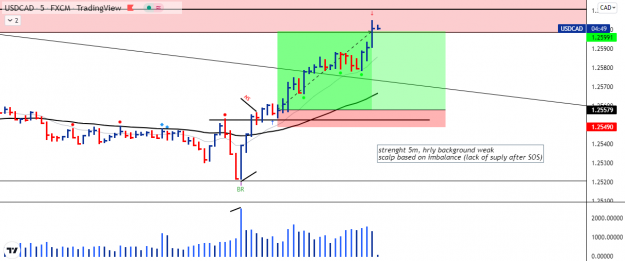
> UC 1hr background weakness, scalped 5m long into that hrly fib based on a lack of supply after obvious strenght, TP hit
UPDATE> EJ BE hit..CJ BE hit after weakness came in
> NU almost stopped me out but heavy supply came in, still running
> UJ more strenght came in and it s marking price up, BE set, trade running
> UC 1hr background weakness, scalped 5m long into that hrly fib based on a lack of supply after obvious strenght, TP hit
Attached Image(s) (click to enlarge)

6