HELLO EVERY ONE
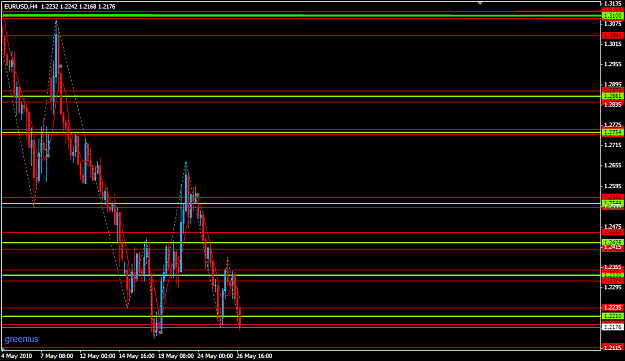
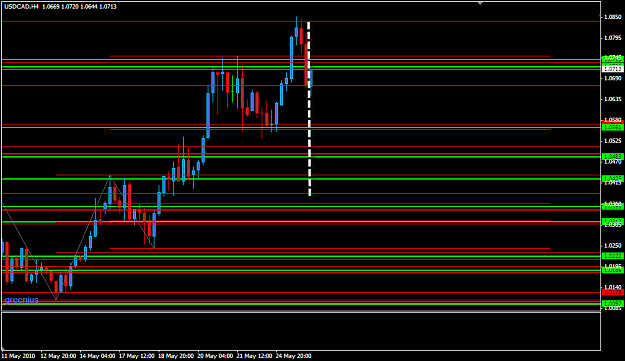
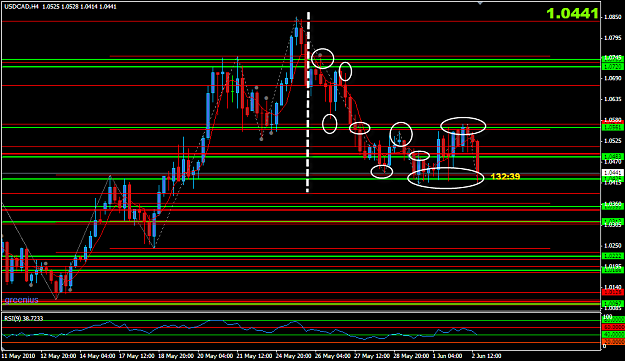
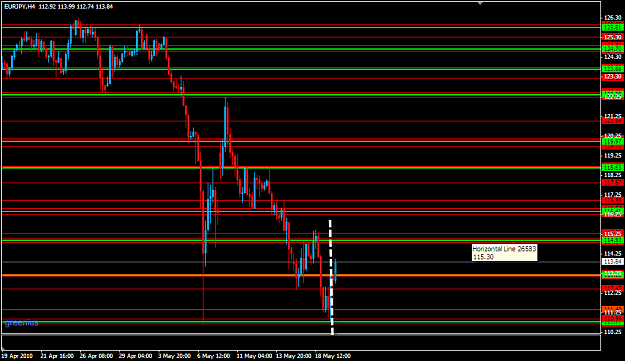
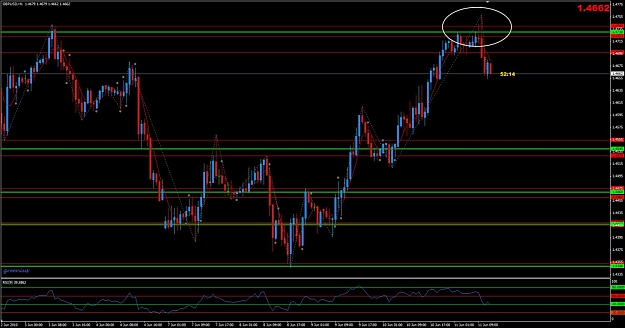
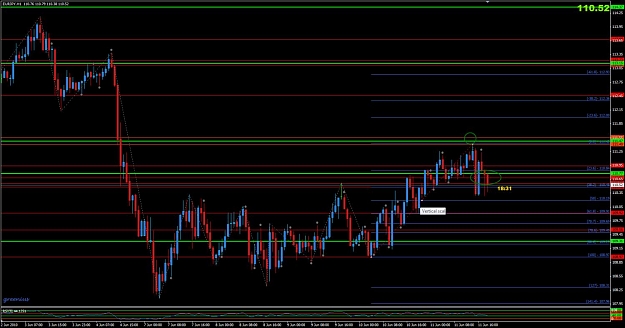
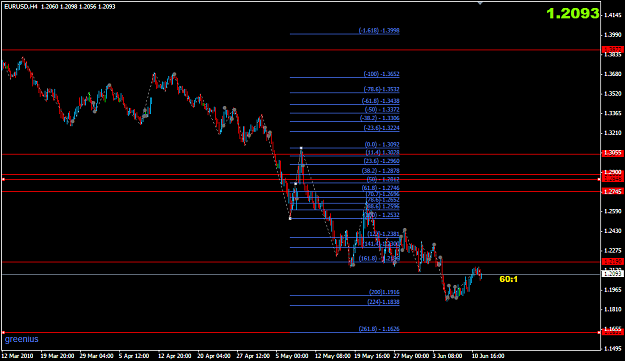
I got this idea on 4h chart i apply zigzag indicator with febo then i draw red line on 32.8 , 61.8 ,161.8 & 261.8 for 10 to 15 p & V in past
after that i have chart full of red line
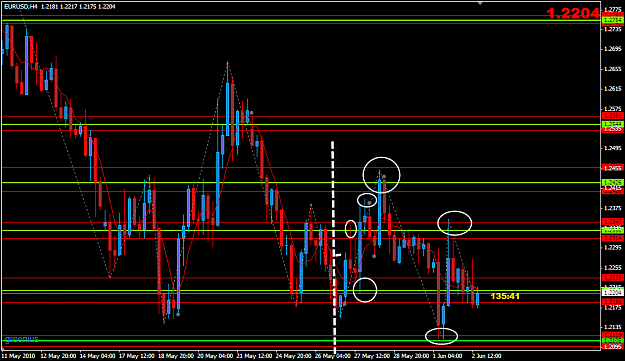
after monitoring price behavior i found he retrace between closed red line and if corss this line he return back to re tested & since my name greenius i decide to add thick green line between those closed red line what happen
let see chart
greenius
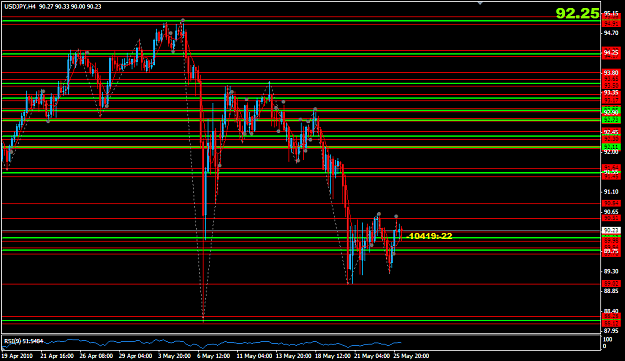
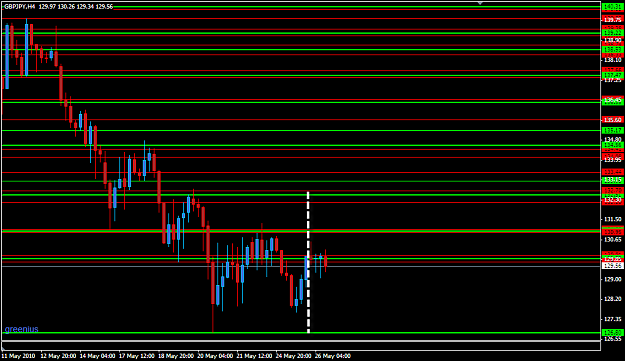
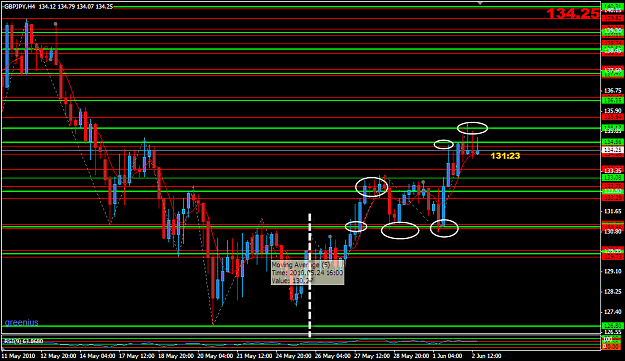
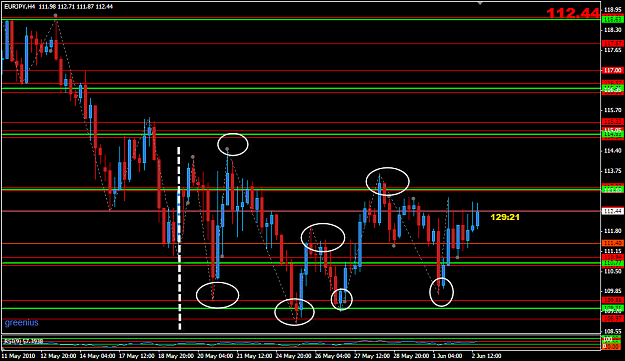
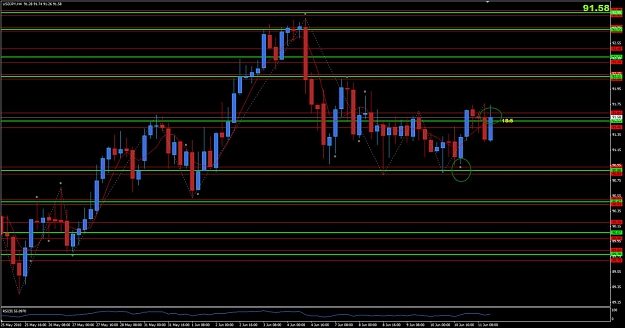
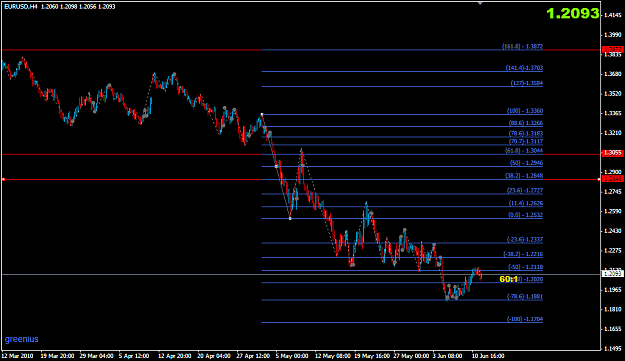
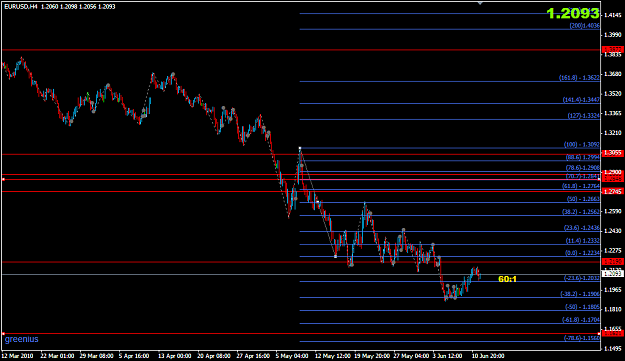
I got this idea on 4h chart i apply zigzag indicator with febo then i draw red line on 32.8 , 61.8 ,161.8 & 261.8 for 10 to 15 p & V in past
after that i have chart full of red line
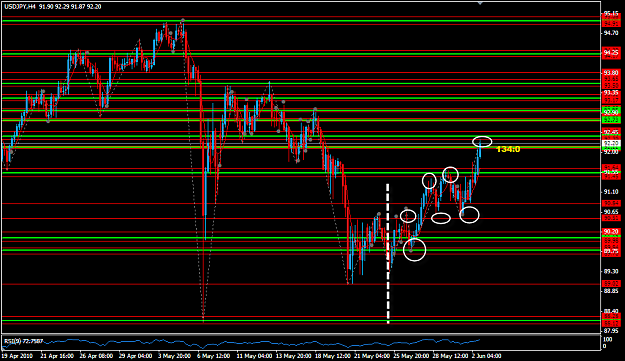
after monitoring price behavior i found he retrace between closed red line and if corss this line he return back to re tested & since my name greenius i decide to add thick green line between those closed red line what happen
let see chart
greenius
GREENIUS