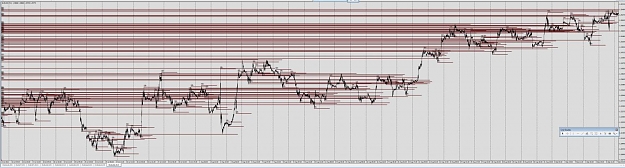
This picture attachment is using the Recent SR with TST file and no other indicators attached. The vertical dashed lines are 1 day, and this is on a M15 chart, so that you can see the how long some of these lines are travelling.
Each of the SR lines starts at a QP, however, they are not obeying the 24 from 24,R,H1 setting in the LineOrBandLength variable, but they are stopping before the current time of the chart, so they are also not behaving like the rays use to with the old indicator....
Afterwards I edited the TST file, to only map LOWs, and instead of obviously dozens of lines (in picture below) there were only 8 lines wrong between 4th May and present time.
Is it possible that somehow the indicator is getting lost in all the different calculations?
Also how are you finding Pepperstone? I was thinking of changing to them from Go....
Attached Image (click to enlarge)