Hi,
Has anyone heard of the repulse indicator ? (I beleive it is included in some charting packages, such as the one used by IG Markets?)
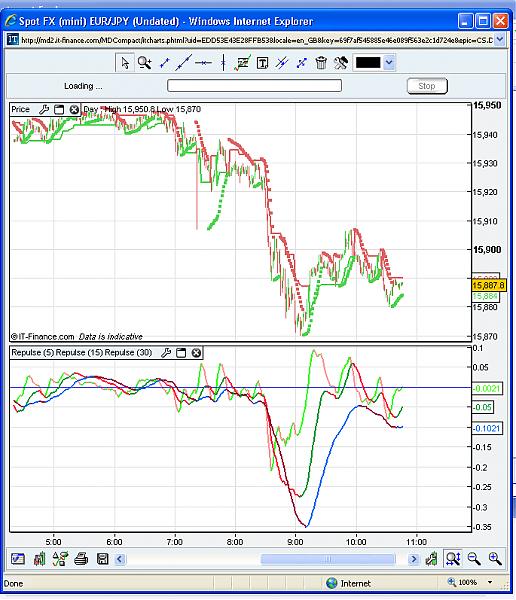
Repulse:
Repulse measures and represents in the form of a curve the push contained in each candlestick. It is a complementary indicator which has no relevance unless compared with the price movement.
However, its main usefulness is not related to price movement in the same way as an RSI, an MACD or a Stochastic indicator. Instead, it offers invaluable additional information on the feeling and confidence that traders have about the markets.
In the futures markets, a good method of identifying trend consists of posting, on the same chart, Repulse(1) (very short term), Repulse(5) (short term) and Repulse(15) (medium term). On a graph in 1mn, for example, you will have a good sense of trend over the 1mn, 5mn and 15 mn time periods.
Repulse gives excellent signals when it slows down into 15, turns into 5 and diverges into 1 while the trend approaches a support or resistance. These signals become very strong when they join divergences on the Cycles indicator (posting in 5mn or 3mn) and accompanied by a significant increase in volume. The success rate becomes VERY high if, in addition to these signals, prices break a trend channel.
Repulses make it possible to increase significantly the average profit per trade by optimizing the points of exit.
The formula is:
lo = LOWEST(LOW)
hi = HIGHEST(HIGH)
a = 100 * ( 3 * CLOSE - 2 * lo - OPEN[p-1] ) / CLOSE
b = 100 * ( OPEN[p-1] + 2 * hi - 3 * CLOSE ) / CLOSE
d = EXPONENTIALAVERAGE[5*p](a) - EXPONENTIALAVERAGE[5*p](b)
RETURN d
I would like to be able to create an indicator based on this- but am having trouble coding it and also understanding what exactly the formula means.
It is a very good indicator and I beleive that it would be very profitable if coded correctly.
Here is a screen shot of the repulse indicator.
Has anyone heard of the repulse indicator ? (I beleive it is included in some charting packages, such as the one used by IG Markets?)
Repulse:
Repulse measures and represents in the form of a curve the push contained in each candlestick. It is a complementary indicator which has no relevance unless compared with the price movement.
However, its main usefulness is not related to price movement in the same way as an RSI, an MACD or a Stochastic indicator. Instead, it offers invaluable additional information on the feeling and confidence that traders have about the markets.
In the futures markets, a good method of identifying trend consists of posting, on the same chart, Repulse(1) (very short term), Repulse(5) (short term) and Repulse(15) (medium term). On a graph in 1mn, for example, you will have a good sense of trend over the 1mn, 5mn and 15 mn time periods.
Repulse gives excellent signals when it slows down into 15, turns into 5 and diverges into 1 while the trend approaches a support or resistance. These signals become very strong when they join divergences on the Cycles indicator (posting in 5mn or 3mn) and accompanied by a significant increase in volume. The success rate becomes VERY high if, in addition to these signals, prices break a trend channel.
Repulses make it possible to increase significantly the average profit per trade by optimizing the points of exit.
The formula is:
lo = LOWEST(LOW)
hi = HIGHEST(HIGH)
a = 100 * ( 3 * CLOSE - 2 * lo - OPEN[p-1] ) / CLOSE
b = 100 * ( OPEN[p-1] + 2 * hi - 3 * CLOSE ) / CLOSE
d = EXPONENTIALAVERAGE[5*p](a) - EXPONENTIALAVERAGE[5*p](b)
RETURN d
I would like to be able to create an indicator based on this- but am having trouble coding it and also understanding what exactly the formula means.
It is a very good indicator and I beleive that it would be very profitable if coded correctly.
Here is a screen shot of the repulse indicator.
Attached Image