• Home
  • Forums
  • Trades
  • News
  • Calendar
  • Market
  • Brokers
  • Login
  • Join
  • User/Email: Password:
  • 7:52am
Menu
  • Forums
  • Trades
  • News
  • Calendar
  • Market
  • Brokers
  • Login
  • Join
  • 7:52am
Sister Sites
  • Metals Mine
  • Energy EXCH
  • Crypto Craft

Options

Bookmark Thread

First Page First Unread Last Page Last Post

Printable Version

Similar Threads

4% A Day Forever 1,431 replies

an EA that worked forever 29 replies

Forever Demo Account 9 replies

  • Commercial Content
  • /
  • Reply to Thread
  • Subscribe
  • 4,707
Attachments: Ichimoku forever
Exit Attachments

Ichimoku forever

  • Last Post
  •  
  • 1 857858Page 859860861 863
  • 1 Page 859 863
  •  
  • Post #17,161
  • Quote
  • Sep 7, 2017 4:02pm Sep 7, 2017 4:02pm
  •  mrithuns
  • | Joined Dec 2015 | Status: Member | 44 Posts
Hi,
Does any one has ichimoku monitor indi which would only show the Kumo Status on the selected Time Frame.
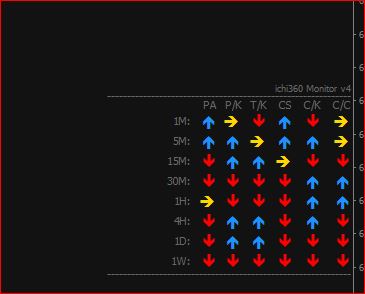
ichi360 monitor would show all the Elements of IChimoku on all the Timeframes.
I have need only to show the PA/KUMO status on the Selected TimeFrame. (m30, H1, H4, D1).
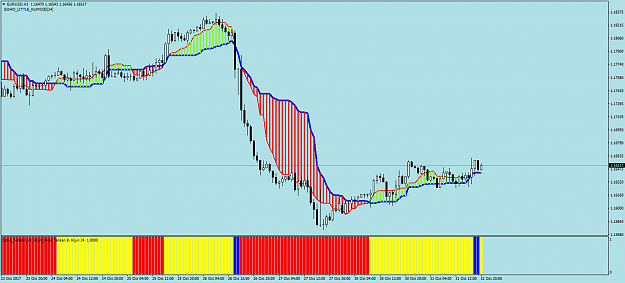
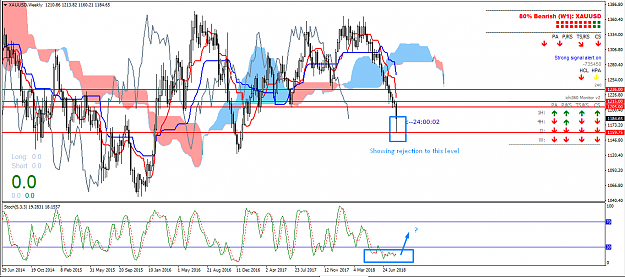
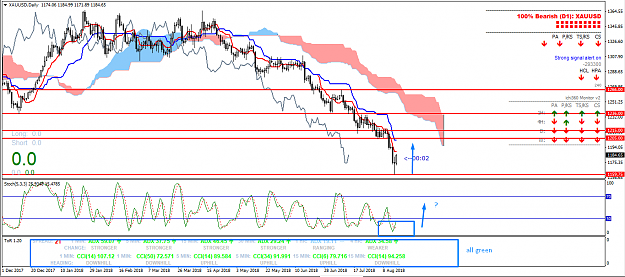
Attached Image
Thanks !!!
  • Post #17,162
  • Quote
  • Sep 8, 2017 3:34am Sep 8, 2017 3:34am
  •  kinonen
  • Joined Feb 2008 | Status: Member | 570 Posts
hello perhaps my indicators on ichimoku can help (see on dec 2010)
bye
  • Post #17,163
  • Quote
  • Sep 12, 2017 9:04pm Sep 12, 2017 9:04pm
  •  karransk
  • | Joined Jul 2012 | Status: Junior Member | 3 Posts
Quoting ThugLife
Disliked
{quote} Thank you for responding to my message. In the last 6 months I have studied the markets for 10 hours a day. I have read Nicole's Elliot book a hundred times, and I have searched through the Internet looking for Japanese articles on Ichimoku. The greatest user of this technique was Sasaki and currently his student Yutaka Yoshino is the second best analysis in Japan. Both of them claim that the three theories are the heart and soul of Ichimoku. Nevertheless through trial and error, I will try to understand the true essence of Ichimoku and...
Ignored
Hi,

I have been studying these markets since 2003 and can't remember how many live accounts I blew (however, all small and I consider these as tuition to learn the markets as demo and live are 2 different things).

All I can say is that after 14 years, I'm still learning as the market is always doing something different.. I have studied all charts, all indicators, everything.. Ultimately, my conclusion is that these are useful tools for trading but my advice is to observe price action without any indicators or signals or whatever.

After about 10 years of observation, you may get some insights into how these patterns work and time and again (especially the spectacular failures when you were 100% sure of one thing and the market proved you wrong), you will develop an ability to look at a chart and figure out what's happening in front of your eyes and you'll know what to do - no indicators, nothing is needed.

Pay attention to your emotions and psychology, as well as your risk in terms of how much you are risking in each trade vs what you are getting .. write everything down in advance and stick to your guns no matter what. If your stop loss hits, just let it do so and next time, set a different stop loss or whatever.

In time, you will develop your own plan and strategy and that will be your primary indicator, your observations on what's going on. It's a skill and I would counsel you to look at a game like poker, which has only 52 cards and skilled players focus on high probability hands based on 2 cards in their hand from a deck of 52 and adjust as they see additional cards revealed and who's in and who's out and how many aces or kings people are possibly holding when they raise or check.

My 2 c.. Of course, you are free to think you are the genius and follow any indicator but in the end, the market always gets you and if you train your eyes to follow the charts and the market / price patterns over 1000s of hours for a number of years, you will develop a real skill greater than any robot, indicator, etc. as the human brain is the top computer of all time and will unconsciously store 000s of patterns.

Try it with small accounts and if you blow up, just re-fund and try again until you develop a strategy.

Best of luck with your trading...
2
  • Post #17,164
  • Quote
  • Sep 13, 2017 9:30am Sep 13, 2017 9:30am
  •  ThugLife
  • | Joined Jun 2017 | Status: Member | 30 Posts
Quoting karransk
Disliked
{quote} Hi, I have been studying these markets since 2003 and can't remember how many live accounts I blew (however, all small and I consider these as tuition to learn the markets as demo and live are 2 different things). All I can say is that after 14 years, I'm still learning as the market is always doing something different.. I have studied all charts, all indicators, everything.. Ultimately, my conclusion is that these are useful tools for trading but my advice is to observe price action without any indicators or signals or whatever. After about...
Ignored

Hello Karransk,

Thank you, for responding to my message. It's always nice to hear the opinion of veteran traders in this forum who are honest in writing there experiences on the market. I have been reading books, articles and journals on some the great forecasters of our time, and the most common theme mentioned by them is crowd psychology. There are many different forms of price action trading, and some of them work if used correctly. Nevertheless, price action explains crowd psychology on the chart without looking at the fundamentals.

Ichimoku Kinko Hyo on its own is a useless indicator, however, the vast majority of the people in the Western hemisphere use it wrongly. This is because they fail to combine the indicator with Goichi Hosoda's three main theories (Time, Price and Wave theory). This makes a big difference on your entry and exit strategy. There is a famous saying in Japanese, "Out of 10,000 practitioners of Ichimoku only 10 people know how to use it properly". A person needs to show, dedication, patience and practice to understand how Goichi Hosoda traded the markets. Unfortunately, most people are too lazy.

The only problem I have is the limited amount of information available online about this theory. Sasaki's book was never translated, which is quite annoying, when all western theories have been translated into Japanese. But it doesn't really matter to me anymore, because I have a good understanding of his wave structure through studying the market and reading Japanese websites. In the mean time I trade using the simple strategy of Supply/Demand.

Anyway, I want to thank you for your advice, and the best luck for your trading.
  • Post #17,165
  • Quote
  • Sep 24, 2017 10:42am Sep 24, 2017 10:42am
  •  mrithuns
  • | Joined Dec 2015 | Status: Member | 44 Posts
Hi,

Can you please help me on checking the chikou span status. I'm expecting this method to return the status of chikouSpan.
The below method will be called on the M5 Candle Close and Check if ChikouSpan is below Tenken,Kijun,SpanA, SpanB and Candles.
Do we really have to shift 26 candles past when use the iIchimoku method to calculate the chikouSpan, Wont it Automatically calculate the ChikouSpan (Past candles 26) from the InpIchimokuB Parameter ?

Quote
Disliked
chikouMain = iIchimoku(symbol,PERIOD_M5,InpIchimokuA,InpIchimokuB,InpIchimokuC,MODE_CHIKOUSPAN,InpIchimokuB),


TradeDirection= (1 or -1) Based on Buy or Sell Direction will be chosen.
double InpIchimokuA=9;
double InpIchimokuB=26;
double InpIchimokuC=52;
bool CheckChikoSpan(const string symbol)
{
double kijun = iIchimoku(symbol,PERIOD_M5,InpIchimokuA,InpIchimokuB,InpIchimokuC,MODE_KIJUNSEN,1),
tenken = iIchimoku(symbol,PERIOD_M5,InpIchimokuA,InpIchimokuB,InpIchimokuC,MODE_TENKANSEN,1),
spana = iIchimoku(symbol,PERIOD_M5,InpIchimokuA,InpIchimokuB,InpIchimokuC,MODE_SENKOUSPANA,1),
spanb = iIchimoku(symbol,PERIOD_M5,InpIchimokuA,InpIchimokuB,InpIchimokuC,MODE_SENKOUSPANB,1),
chikouMain = iIchimoku(symbol,PERIOD_M5,InpIchimokuA,InpIchimokuB,InpIchimokuC,MODE_CHIKOUSPAN,InpIchimokuB),// HELP REQUIRED HERE
close = iClose(symbol,PERIOD_M5,InpIchimokuB); //shifted 26 candles past to know the candle value.
if(TradeDirection*(chikouMain-kijun)<0) return 0;
if(TradeDirection*(chikouMain-tenken)<0)return 0;
if(TradeDirection*(chikouMain-spana)<0) return 0;
if(TradeDirection*(chikouMain-spanb)<0) return 0;
if(TradeDirection*(chikouMain-close)<0) return 0;
return true;
}
Thanks !!!
  • Post #17,166
  • Quote
  • Oct 14, 2017 6:18am Oct 14, 2017 6:18am
  •  ramzam
  • Joined Nov 2015 | Status: Member | 2,878 Posts
Quoting mrithuns
Disliked
hi, can you please help me on checking the chikou span status. I'm expecting this method to return the status of chikouspan. The below method will be called on the m5 candle close and check if chikouspan is below tenken,kijun,spana, spanb and candles. Do we really have to shift 26 candles past when use the iichimoku method to calculate the chikouspan, wont it automatically calculate the chikouspan (past candles 26) from the inpichimokub parameter ? {quote} tradedirection= (1 or -1) based on buy or sell direction will be chosen. Double inpichimokua=9;...
Ignored
no one help u ah.....................post in i will code your indicator or ea for free of charge page
Success is a Journey Not a Destination....... kind regards ramzam
  • Post #17,167
  • Quote
  • Oct 14, 2017 11:32am Oct 14, 2017 11:32am
  •  Teslatrader
  • | Commercial Member | Joined Sep 2017 | 5 Posts
I use Ichimoku in my EA. I have found good success with using this indicator.


------------------------
Forex Signal Provider & Trading Coach
  • Post #17,168
  • Quote
  • Oct 31, 2017 12:51pm Oct 31, 2017 12:51pm
  •  liquidice
  • Joined Aug 2014 | Status: Member | 591 Posts
Quoting Sohocool
Disliked
{quote} Hi abmmalay, Here the chinkou histo You can use Chinkou Candles ,also : (Chinkou is Price lagged -Kijun Sen Periods ) http://www.forexfactory.com/showthre...57#post7051257 Regards. {image} {image} {file}
Ignored
Hi Sohocool,

Thank you for all the indies that you made, I try to find a Kijun-Tenkan Cross Histogram but unable to find that here. Do you mind attach it here please?

Thank you again Sohocool.
  • Post #17,169
  • Quote
  • Oct 31, 2017 2:32pm Oct 31, 2017 2:32pm
  •  Sohocool
  • Joined Dec 2009 | Status: Member | 404 Posts
Quoting liquidice
Disliked
{quote} Hi Sohocool, Thank you for all the indies that you made, I try to find a Kijun-Tenkan Cross Histogram but unable to find that here. Do you mind attach it here please? Thank you again Sohocool.
Ignored
Hi Liquidice,

I have this Histogram .

When the histo is yellow : the Tekan is above Kijun.

When the histo is red :the Tekan is below Kijun.

When the histo is blue : Tenkan = Kijun.

Regards.


PS Little Kumo : https://www.forexfactory.com/showthread.php?t=595993


Attached Image (click to enlarge)
Click to Enlarge

Name: EURUSDH1littlekumo.png
Size: 48 KB
Attached File
File Type: mq4 #Soho_Tenkan_VS_Kijun_Histo.mq4   6 KB | 985 downloads
KISS&V :Keep it simple safe & visual
1
  • Post #17,170
  • Quote
  • Edited Nov 1, 2017 2:24am Oct 31, 2017 10:07pm | Edited Nov 1, 2017 2:24am
  •  liquidice
  • Joined Aug 2014 | Status: Member | 591 Posts
Quoting Sohocool
Disliked
{quote} Hi Liquidice, I have this Histogram . When the histo is yellow : the Tekan is above Kijun. When the histo is red :the Tekan is below Kijun. When the histo is blue : Tenkan = Kijun. Regards. PS Little Kumo : https://www.forexfactory.com/showthread.php?t=595993 {image} {file}
Ignored
Awesome! Thank you Sohocool for your help ... I'm going to try your little kumo system ... It looks good.

Thanks again Sohocool
  • Post #17,171
  • Quote
  • Nov 5, 2017 4:27pm Nov 5, 2017 4:27pm
  •  T4Trade
  • Joined Sep 2017 | Status: Trend Following,Price Action,Marti | 1,631 Posts
can anyone please guideme with ichimuko indicator? it is hiding my gid line that is price line and ask price line,how to fix it?
  • Post #17,172
  • Quote
  • Nov 27, 2017 9:50pm Nov 27, 2017 9:50pm
  •  jay1994
  • | Joined Jul 2013 | Status: Junior Member | 5 Posts
Does anyone have an indicator that sound alerts when price touches the Senkou Span A and Senkou Span B, otherwise known as the Kumo cloud? Thanks in advanced.
  • Post #17,173
  • Quote
  • Nov 28, 2017 4:20pm Nov 28, 2017 4:20pm
  •  jay1994
  • | Joined Jul 2013 | Status: Junior Member | 5 Posts
Quoting jay1994
Disliked
Does anyone have an indicator that sound alerts when price touches the Senkou Span A and Senkou Span B, otherwise known as the Kumo cloud? Thanks in advanced.
Ignored
Any help with this?
  • Post #17,174
  • Quote
  • Dec 14, 2017 2:31am Dec 14, 2017 2:31am
  •  Jiris109
  • | Membership Revoked | Joined Feb 2011 | 181 Posts
maybe you can start to trade without any indi
Attached Image (click to enlarge)
Click to Enlarge

Name: Image1.png
Size: 24 KB
SDPAFX(dot)com Knowledge-Base
  • Post #17,175
  • Quote
  • Dec 28, 2017 4:57am Dec 28, 2017 4:57am
  •  Jiris109
  • | Membership Revoked | Joined Feb 2011 | 181 Posts
Slowly drifted Cabel long with a nice profit, I think there is still room to new highs, but closed profit is closed profit
Attached Image (click to enlarge)
Click to Enlarge

Name: GBPUSD-ECNM15.jpg
Size: 71 KB
SDPAFX(dot)com Knowledge-Base
  • Post #17,176
  • Quote
  • May 30, 2018 8:03am May 30, 2018 8:03am
  •  syks7117
  • | Joined May 2018 | Status: Junior Member | 1 Post
Quoting Sohocool
Disliked
{quote} Hi Liquidice, I have this Histogram . When the histo is yellow : the Tekan is above Kijun. When the histo is red :the Tekan is below Kijun. When the histo is blue : Tenkan = Kijun. Regards. PS Little Kumo : https://www.forexfactory.com/showthread.php?t=595993 {image} {file}
Ignored
Hi Sohocool,

I really enjoy your indicator you made . I have some idea.

1) Would you be able to make an indicator with all three histogram together ( Kumo, TK, Chikou) option with select to show three or just one. Also option for time frame like 60, 240 or even 1440. Meaning I can attached and show different time frame.
2) Would you be able to make arrow to show up when all three ( Kumo, TK, Chikou) give a signal. To have first kumo breakout and 2nd Breakout follow the Kumo.

Thanks a lot.
  • Post #17,177
  • Quote
  • Jul 25, 2018 10:52am Jul 25, 2018 10:52am
  •  ichikuse
  • Joined Apr 2017 | Status: Member | 451 Posts
Quoting BataviaTrade
Disliked
Is Ichimoku not just a bunch of 4 moving averages? 1. Tenkan Sen 2. Kijun Sen 3. Senkou A 4. Senkou B Including the last 2 which make up the "cloud"? The only add-on I would say is the Chikou Span and the forwarded projection of Senkou A&B. But other than that, in the end it comes down to these 4 MA's. Am I wrong? If so, what is so special about Ichimoku?
Ignored
It is MAS indeed.I think the reason people like the ichimoku is all to do with the implications of the cloud created by the MAS.It seems someone is more confident to take an ichi trade when its on either side of the cloud because in their mind the cloud is quite a barrier, almost using it as a real cloud in real life.So, many wont be as confident if the ichimoku was purely MAS minus the actual cloud.So its all an illusion really yet a powerful one and id rather have the cloud than MAS alone too .This doesnt discredit the ichimoku though because its setup creates nice and significant S/R zones.
The best indicator to compliment price action is a moving average in my humble opinion! No wonder the best indicators i believe are MA based eg the MACD.
  • Post #17,178
  • Quote
  • Aug 18, 2018 10:35pm Aug 18, 2018 10:35pm
  •  SantoTrader
  • | Joined Apr 2017 | Status: Junior Member | 7 Posts
XAUUSD (monthly)

What are in the chart ?

1. The trend is sideway
2. Future kumo (bullish bias)
3. TS above KS (bullish bias)
4. The price in the area of strong support (bullish preference).
5. CS below the price, KS & TS (bearish bias)
6. The price broke down the chart (bearish bias)

Conclusion : Less bearish bias based on this chart. The breaking out can be false regarding the future kumo and TS & KS position now. The price likely will reverse to go up anytime.

We go to lower time frame to get the more clue.
Attached Image (click to enlarge)
Click to Enlarge

Name: Gold monthly.png
Size: 48 KB
  • Post #17,179
  • Quote
  • Aug 18, 2018 11:01pm Aug 18, 2018 11:01pm
  •  SantoTrader
  • | Joined Apr 2017 | Status: Junior Member | 7 Posts
XAUUSD (weekly)
What are in the chart?

1. CS below cloud (bearish bias)
2. Future kumo (strong bearish bias)
3. TS below KS (strong bearish bias)
4. Price show rejection level support (bullish preference)
5. Stochastic is oversold (bullish preference)
6. SSA flat (bullish preference)

Conclusion : The chart show us that the trend is strong bearish but the price has a chance to retrace.

Where ? the near resistance area 1205-1215 should be watched carefully.
Attached Image (click to enlarge)
Click to Enlarge

Name: Weekly gold.png
Size: 77 KB
  • Post #17,180
  • Quote
  • Aug 18, 2018 11:23pm Aug 18, 2018 11:23pm
  •  SantoTrader
  • | Joined Apr 2017 | Status: Junior Member | 7 Posts
Gold Daily.

What we get from the chart ?

1. Strong momentum bullish (Tor 1.2 all green)
2. Stoch is oversold (bullish preference)
3. There is candle shift from black to white (bullish preference)
4. TS & KS flat (pullback signal)
5. SSA & SSB flat (pullback signal)

Conclusion : Daily chart show more clue about the bearish trend still exist but the pullback treat this trend.

So, we go to H4 for detail info.
Attached Image (click to enlarge)
Click to Enlarge

Name: Gold Daily.png
Size: 58 KB
  • Commercial Content
  • /
  • Ichimoku forever
  • Reply to Thread
    • 1 857858Page 859860861 863
    • 1 Page 859 863
1 trader viewing now
  • More
Top of Page
  • Facebook
  • Twitter
About FF
  • Mission
  • Products
  • User Guide
  • Media Kit
  • Blog
  • Contact
FF Products
  • Forums
  • Trades
  • Calendar
  • News
  • Market
  • Brokers
  • Trade Explorer
FF Website
  • Homepage
  • Search
  • Members
  • Report a Bug
Follow FF
  • Facebook
  • Twitter

FF Sister Sites:

  • Metals Mine
  • Energy EXCH
  • Crypto Craft

Forex Factory® is a brand of Fair Economy, Inc.

Terms of Service / ©2021