!!!!DO NOT TRADE THIS SYSTEM!!! IT IS MEANT ONLY AS A GUIDE TO HELP YOU LEARN.
Hi,
I am also relatively new to Forex Trading and indeed Forex Factory.
Spent a year of my life studying all I could about Fibonacci Levels, basic Candle patters etc. Then, I fell into the system and indicator trap.
I tried so many systems, constantly switching them for their lack of consistency, cursing them when they failed me. Blah, off to find another system or indicator. My charts ended up looking like a Jackson Pollock painting, No detriment to Jackson Pollock intended.
I realized after all this, that it is not the system that fail's most of the time, it is ourselves when we use them with little understanding of what is going on in the market.
My goal in writing this is not, to look good or treat newcomers to forex like they are idiots, it is in the hope that even one single person will not fall into the trap I did as mentioned above.
If any senior members would like to join this thread and help out, Great.
The only thing I ask is that no indicators are added as, before we know it, this thread will become just like any other thread with tons of indicators that tell you nothing about where price is going to go.
indicators were created by brokers to spread the seeds of confusion so that they may continue to rip rip off your SL. Only kidding, and yes, I use indicators.
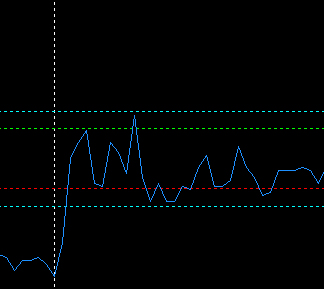
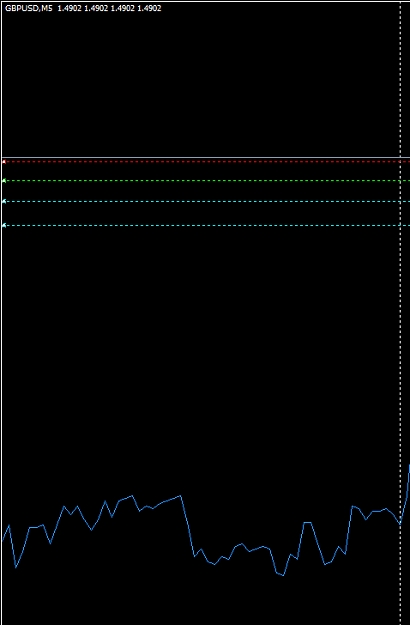
Anyway, in this Snakes and Ladders thread we have the best 5 indicators you will ever find. I have added my template which you can download by clicking on then drop it in the TEMPLATE directory of your MT4 terminal.
Indicators FREE in this system.LoL
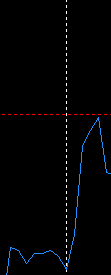
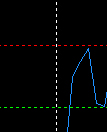
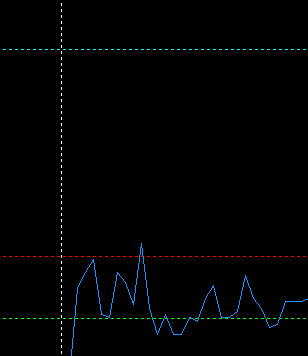
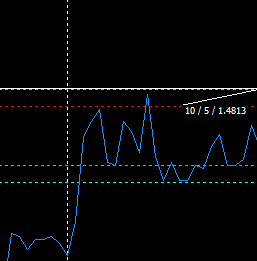
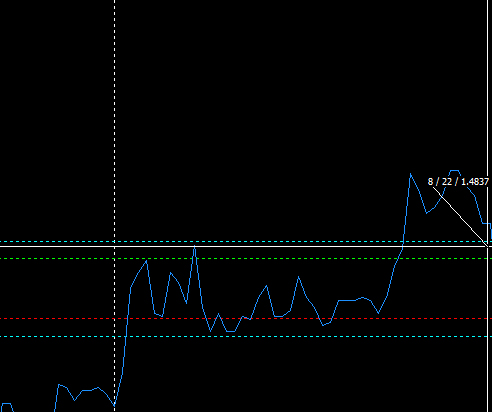
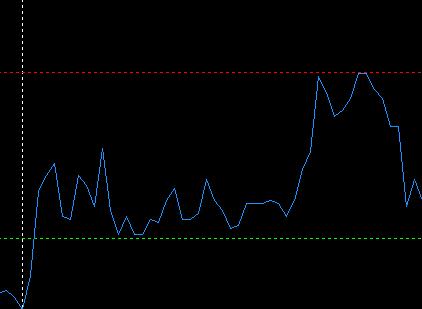
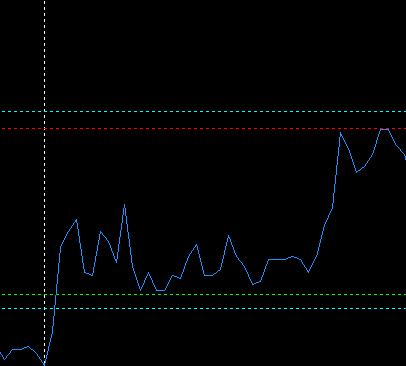
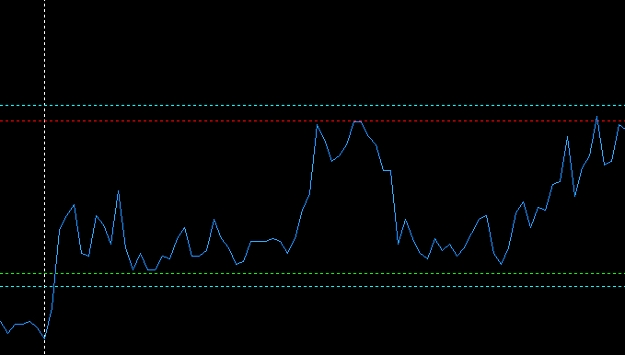
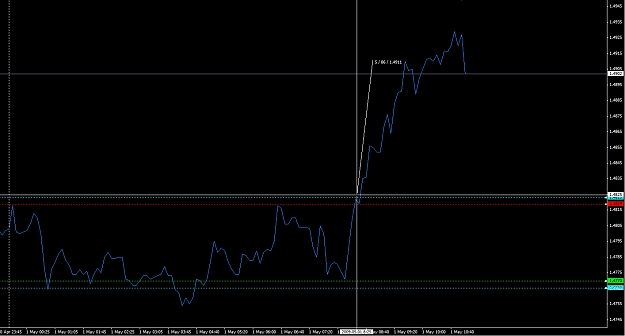
1: price (The blue Line)(snake)
2: Red Line
3: 1 Green Line
4: 2 Blue Lines
This template is the GBP/USD 5 Min time frame but will work equally as well on any time frame or pair of currencies.
Hi,
I am also relatively new to Forex Trading and indeed Forex Factory.
Spent a year of my life studying all I could about Fibonacci Levels, basic Candle patters etc. Then, I fell into the system and indicator trap.
I tried so many systems, constantly switching them for their lack of consistency, cursing them when they failed me. Blah, off to find another system or indicator. My charts ended up looking like a Jackson Pollock painting, No detriment to Jackson Pollock intended.
I realized after all this, that it is not the system that fail's most of the time, it is ourselves when we use them with little understanding of what is going on in the market.
My goal in writing this is not, to look good or treat newcomers to forex like they are idiots, it is in the hope that even one single person will not fall into the trap I did as mentioned above.
If any senior members would like to join this thread and help out, Great.
The only thing I ask is that no indicators are added as, before we know it, this thread will become just like any other thread with tons of indicators that tell you nothing about where price is going to go.
indicators were created by brokers to spread the seeds of confusion so that they may continue to rip rip off your SL. Only kidding, and yes, I use indicators.
Anyway, in this Snakes and Ladders thread we have the best 5 indicators you will ever find. I have added my template which you can download by clicking on then drop it in the TEMPLATE directory of your MT4 terminal.
Indicators FREE in this system.LoL
1: price (The blue Line)(snake)
2: Red Line
3: 1 Green Line
4: 2 Blue Lines
This template is the GBP/USD 5 Min time frame but will work equally as well on any time frame or pair of currencies.
Attached Image (click to enlarge)
Attached File(s)
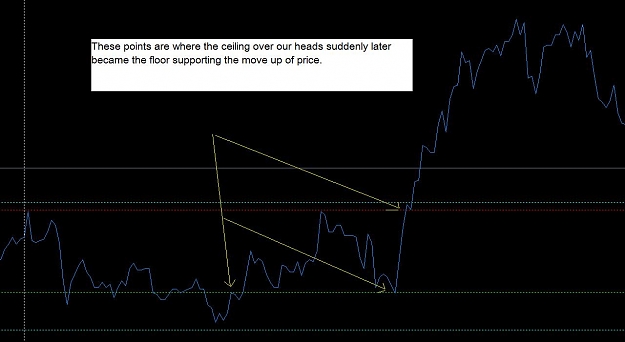
Starting to see instead of just looking.