• Home
  • Forums
  • Trades
  • News
  • Calendar
  • Market
  • Brokers
  • Login
  • Join
  • 12:43am
Menu
  • Forums
  • Trades
  • News
  • Calendar
  • Market
  • Brokers
  • Login
  • Join
  • 12:43am
Sister Sites
  • Metals Mine
  • Energy EXCH
  • Crypto Craft

Options

Bookmark Thread

First Page First Unread Last Page Last Post

Print Thread

Similar Threads

Open Price and Engulfing Bars 104 replies

"Bullish Engulfing Bar" and "Bearish Engulfing Bar" trade 88 replies

Can someone code the Engulfing Bars Arrow Indicator? 6 replies

Definition of Bullish Outside Engulfing and Bearish Outside Engulfing 3 replies

Inside bars vs pin bars 3 replies

  • Trading Systems
  • /
  • Reply to Thread
  • Subscribe
  • 22
Attachments: Engulfing bars
Exit Attachments
Tags: Engulfing bars
Cancel

Engulfing bars

  • Last Post
  •  
  • 1 2Page 3456 7
  • 1 2Page 34 7
  •  
  • Post #41
  • Quote
  • Apr 25, 2011 10:37pm Apr 25, 2011 10:37pm
  •  darrenlittle
  • | Joined Sep 2010 | Status: Member | 178 Posts
I know this is breaking the 50 sma rule, but like i said, sometimes i will take a countertrend trade.... but i will be more cautious with my stops..

http://i1222.photobucket.com/albums/.../guengulf2.png
 
 
  • Post #42
  • Quote
  • Edited Apr 26, 2011 5:12am Apr 25, 2011 10:42pm | Edited Apr 26, 2011 5:12am
  •  darrenlittle
  • | Joined Sep 2010 | Status: Member | 178 Posts
possible EJ short, below the 50sma and broke support

Never triggered on next bar cancelled the order.......

http://i1222.photobucket.com/albums/...26at034107.png
 
 
  • Post #43
  • Quote
  • Apr 25, 2011 11:10pm Apr 25, 2011 11:10pm
  •  FusionF
  • | Joined Jan 2011 | Status: Member | 46 Posts
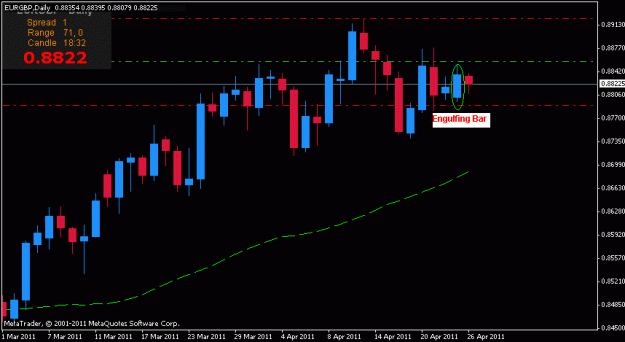
In the chart below is EUR/GBP daily. The green dashed line is the 50sma. The green circle is the engulfing bar.

Since the price is above the 50sma I'll take only long positions.

I have entered a buy stop order at 0.8857 (5 pips higher than the engulfing bar's high).
SL at 0.8791 (5 pips lower than the engulfing bar's low).
TP at 0.8923 (the same pips as the SL).

Let's see how it'll go.

If the buy stop is not hit by tomorrow morning (I am in CST zone) I will cancel the buy stop as it will be well into the London session by then. That would mean that there is no momentum.
Attached Image (click to enlarge)
Click to Enlarge

Name: eurgbp.gif
Size: 12 KB
 
 
  • Post #44
  • Quote
  • Apr 26, 2011 5:13am Apr 26, 2011 5:13am
  •  darrenlittle
  • | Joined Sep 2010 | Status: Member | 178 Posts
Quoting darrenlittle
Disliked
ECHF trade update, took half profits at +44 shotting for next support with the rest, not bad on a day like today

http://i1222.photobucket.com/albums/...25at164628.png
Ignored
Got tp2 73 pips.... closed

http://i1222.photobucket.com/albums/...echfengulf.png
 
 
  • Post #45
  • Quote
  • Apr 26, 2011 7:31am Apr 26, 2011 7:31am
  •  arjfca
  • | Joined Nov 2009 | Status: Member | 222 Posts
Quoting HiddenGap
Disliked
This is one of my favorite Japanese Candlestick patterns.

What we have here is really 2 patterns in 1. This is both a valid bullish engulfing doji pattern and a vallid high close doji pattern.

Many Price Action only traders will have both a pattern signal and an entry signal. They will wait for the price to trade back down below the high of the engulfing candle (into its body) to enter long, rather than chase price. Therefore it is possible to get a valid pattern signal and not a valid entry signal.
Ignored

Hello HiddenGap

I truly like your trading approach. Could you provide a link or info on how you calculate your PT points.

I'm a believer that the closing of a trade is more important than the entry. Money is gain or loss is always based on the exit.

When your PT is reach, do you scale down your position or you are using the target as a reason to raise ( lower) your stop.

Are these target pre-defined before entering a position or you defined them as the trend is unfolding.

Martin
 
 
  • Post #46
  • Quote
  • Apr 26, 2011 5:18pm Apr 26, 2011 5:18pm
  •  HiddenGap
  • Joined Aug 2009 | Status: Reading the tape | 2,324 Posts
We've all heard it before, you need to look left to trade right.

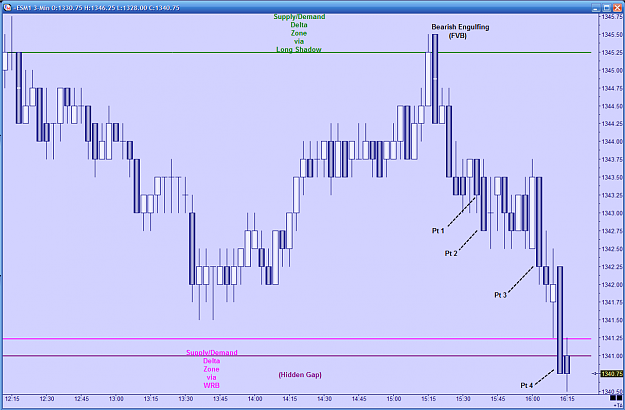
First chart:

This is an interesting late day trade set up in the ES. We can see that there is a bearish engulfing candle line. However, this is not a valid bearish engulfing pattern from my perspective. But, there is a second type of signal happening there as well. So the sum of those two things occurring at the same time increases the probability of the trade.

What's more important, arguably, is where this is happening. Another way to put that is, what is the context of the prior price action in which this signal is now appearing?

Well, let's look left.......

Second Chart:

We see a valid bearish engulfing doji pattern. The long shadow of the Doji line is our key change in the Supply/Demand Dynamic in the market. Unfortunately, I can not take this trade because it does not occur with an Supply Demand Delta Zone. But..........

It creates a zone and thereby gives us an understanding of the price action prior to the trade signal that arises later. By looking left, we are now able to trade right.
Attached Image(s) (click to enlarge)
Click to Enlarge

Name: Price Action 3.png
Size: 111 KB
Click to Enlarge

Name: Price Action 4.png
Size: 83 KB
Wyckoff VSA: (1) Supply vs Demand (2) Effort vs Result (3) Cause vs Effect
 
 
  • Post #47
  • Quote
  • Apr 26, 2011 5:45pm Apr 26, 2011 5:45pm
  •  darrenlittle
  • | Joined Sep 2010 | Status: Member | 178 Posts
nice post hidden gap not just what, but where too....
 
 
  • Post #48
  • Quote
  • Apr 26, 2011 8:13pm Apr 26, 2011 8:13pm
  •  EZTrades
  • | Joined May 2009 | Status: Member | 86 Posts
darrenlittle,


I watched the webinar by Steve Primo and found it very informative and gave very good instructions on using this method. I do have a question for you that I didnt hear Steve Primo answer during the webinar . Lets say that price is above 50SMA so we are only looking to buy. We get a Bullish engulfing bar ( signal bar ) but say the next 2 -3 days our entry isnt triggered because price didnt break the high of the engulfing bar by 2-5 pips , how long do you keep your order open to buy before you close it and wait for the next signal ? Also , if we have the same set-up as I just mentioned and the next bar gaps up , do you enter at the market or cancel your order and wait for the next signal ?

Thank you ,

EZTrades
" Master Your Set-Up , Master Yourself "
 
 
  • Post #49
  • Quote
  • Apr 26, 2011 8:26pm Apr 26, 2011 8:26pm
  •  FusionF
  • | Joined Jan 2011 | Status: Member | 46 Posts
I closed it at 0.8910 for +53 pips.


Quoting FusionF
Disliked
In the chart below is EUR/GBP daily. The green dashed line is the 50sma. The green circle is the engulfing bar.

Since the price is above the 50sma I'll take only long positions.

I have entered a buy stop order at 0.8857 (5 pips higher than the engulfing bar's high).
SL at 0.8791 (5 pips lower than the engulfing bar's low).
TP at 0.8923 (the same pips as the SL).

Let's see how it'll go.

If the buy stop is not hit by tomorrow morning (I am in CST zone) I will cancel the buy stop as it will be well into the London session by then. That would...
Ignored
 
 
  • Post #50
  • Quote
  • Apr 26, 2011 8:38pm Apr 26, 2011 8:38pm
  •  FusionF
  • | Joined Jan 2011 | Status: Member | 46 Posts
Quoting EZTrades
Disliked
darrenlittle,


I watched the webinar by Steve Primo and found it very informative and gave very good instructions on using this method. I do have a question for you that I didnt hear Steve Primo answer during the webinar . Lets say that price is above 50SMA so we are only looking to buy. We get a Bullish engulfing bar ( signal bar ) but say the next 2 -3 days our entry isnt triggered because price didnt break the high of the engulfing bar by 2-5 pips , how long do you keep your order open to buy before you close it and wait for the next signal...
Ignored
Hi EZTrades,

I think he says somewhere in the video that if the trade isn't triggered until the end of the day/candle then cancel the order but don't quote me on that. Maybe darrenlittle knows. But at least that's what I do as it would mean that there is no momentum.

By entering with a market order when you have a gap that would increase the risk and it would probably be because of some important news. I guess it depends on your risk tolerance and money management. Personally, I wouldn't take the trade. I don't like chasing trades I prefer them chasing me
 
 
  • Post #51
  • Quote
  • Apr 26, 2011 8:50pm Apr 26, 2011 8:50pm
  •  EZTrades
  • | Joined May 2009 | Status: Member | 86 Posts
Fusion F ,

Thanks for your reply . Thats sounds logical to me . Congratulations on your 53 pip winner today ! Nice trade !


Thanks again ,

EZTrades
" Master Your Set-Up , Master Yourself "
 
 
  • Post #52
  • Quote
  • Apr 26, 2011 9:28pm Apr 26, 2011 9:28pm
  •  FusionF
  • | Joined Jan 2011 | Status: Member | 46 Posts
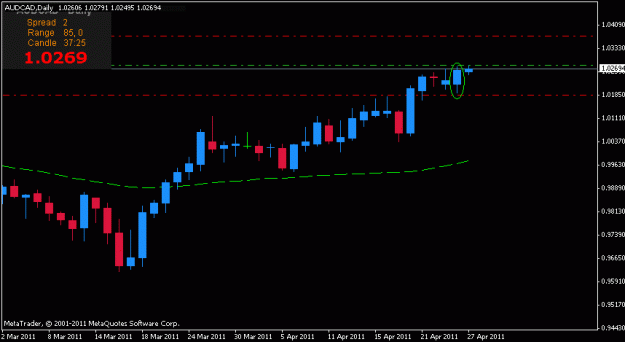
Here's a trade I just entered.
AUD/CAD
Buy stop: 1.0280
SL: 1.0186
TP: 1.0374

Also keep in mind that the Australian CPI is coming out. If the news are good it'll explode...
Attached Image (click to enlarge)
Click to Enlarge

Name: audcad042611.gif
Size: 10 KB
 
 
  • Post #53
  • Quote
  • Apr 26, 2011 10:08pm Apr 26, 2011 10:08pm
  •  darrenlittle
  • | Joined Sep 2010 | Status: Member | 178 Posts
Quoting EZTrades
Disliked
darrenlittle,


I watched the webinar by Steve Primo and found it very informative and gave very good instructions on using this method. I do have a question for you that I didnt hear Steve Primo answer during the webinar . Lets say that price is above 50SMA so we are only looking to buy. We get a Bullish engulfing bar ( signal bar ) but say the next 2 -3 days our entry isnt triggered because price didnt break the high of the engulfing bar by 2-5 pips , how long do you keep your order open to buy before you close it and wait for the next signal...
Ignored
if it doesnt trigger next bar you cancel the order, the idea is to get in on a sustained momentum move.

You should trade these with buy stops and sell stops so (depending on your broker) you should be entered at the price you set.
 
 
  • Post #54
  • Quote
  • Apr 26, 2011 10:20pm Apr 26, 2011 10:20pm
  •  darrenlittle
  • | Joined Sep 2010 | Status: Member | 178 Posts
anyone for real easy pips?

http://i1222.photobucket.com/albums/...s/auengulf.png
 
 
  • Post #55
  • Quote
  • Apr 27, 2011 12:12am Apr 27, 2011 12:12am
  •  pierre23
  • | Joined Mar 2009 | Status: Member | 217 Posts
Quoting darrenlittle
Disliked
anyone for real easy pips?

http://i1222.photobucket.com/albums/...s/auengulf.png
Ignored
Hi mate, is this a daily chart?

Edit: sorry looks more like a H4, is that correct?
 
 
  • Post #56
  • Quote
  • Apr 27, 2011 12:56am Apr 27, 2011 12:56am
  •  webforex
  • | Joined Sep 2008 | Status: Member | 137 Posts
I have a indicator for engulf candle

But not giving out correct signals well

MQL coder PM me if can help out
 
 
  • Post #57
  • Quote
  • Apr 27, 2011 5:09am Apr 27, 2011 5:09am
  •  darrenlittle
  • | Joined Sep 2010 | Status: Member | 178 Posts
Quoting pierre23
Disliked
Hi mate, is this a daily chart?

Edit: sorry looks more like a H4, is that correct?
Ignored
yes 4hr
 
 
  • Post #58
  • Quote
  • Apr 27, 2011 9:19am Apr 27, 2011 9:19am
  •  darrenlittle
  • | Joined Sep 2010 | Status: Member | 178 Posts
GCHF 4HR..

this was countertrend and only a tiny engulfing candle, but location and the pin bar was the real trigger... also GBP news was good... high probability trade

http://i1222.photobucket.com/albums/...27at141716.png
 
 
  • Post #59
  • Quote
  • Apr 27, 2011 9:27am Apr 27, 2011 9:27am
  •  Location
  • | Joined Jun 2010 | Status: Member | 64 Posts
Quoting darrenlittle
Disliked
GCHF 4HR..

this was countertrend and only a tiny engulfing candle, but location and the pin bar was the real trigger... also GBP news was good... high probability trade
Ignored
Hi Darren:

There are two things that would have kept me out of this trade: 1) It's countertrend. Maybe, when I get good at the original method, I will begin to explore CT trading. 2) You were trading right into the 1.45 BRN. Did you enter after it crossed 1. 45? I can't read the numbers on your chart.

If not, it looks risky to me. Glad it worked out for you.

Location
 
 
  • Post #60
  • Quote
  • Apr 27, 2011 9:32am Apr 27, 2011 9:32am
  •  tradestar1
  • Joined Nov 2009 | Status: Member | 996 Posts
Quoting Dreamliner
Disliked
And HUGE costs to be trained--sheesh, nearly 8,000.00 for Forex training.
Ignored
There are suckers born every minute that would throw their money at that bogus training.
 
 
  • Trading Systems
  • /
  • Engulfing bars
  • Reply to Thread
    • 1 2Page 3456 7
    • 1 2Page 34 7
0 traders viewing now
  • More
Top of Page
  • Facebook
  • Twitter
About FF
  • Mission
  • Products
  • User Guide
  • Media Kit
  • Blog
  • Contact
FF Products
  • Forums
  • Trades
  • Calendar
  • News
  • Market
  • Brokers
  • Trade Explorer
FF Website
  • Homepage
  • Search
  • Members
  • Report a Bug
Follow FF
  • Facebook
  • Twitter

FF Sister Sites:

  • Metals Mine
  • Energy EXCH
  • Crypto Craft

Forex Factory® is a brand of Fair Economy, Inc.

Terms of Service / ©2023