The Better Volume indicator is an MT4 indicator, designed with more outstanding features than the default Volume histogram indicator on the regular MT4 terminals. This indicator deploys different colors to represent the volume of the market which is way better than the typical histogram bar.
Volume is an important deciding factor in the forex market. It is a function of different trading activities (fundamentals and technical) that take place in the market.
The indicator can come in handy for interpreting trend and volume of the market. This is because the Better Volume indicator is built in line with the market volume algorithm to keep close track of the continual volume changes in the market.
No system can accurately keep track of the fluctuations in the forex market, the Better Volume indicator isn’t an exception. But the indicator’s signals are good enough to rely on though.
As a forex trader, you’ll find this indicator very useful in your day-day trading analysis. It helps you to define the trend of the market, clear-cut reversal levels, and to anticipate pullbacks. You don't need to crowd your trading dashboard with all sorts of volume indicators because this indicator is well optimized to interpret volume.
The Better Volume Indicator Signals
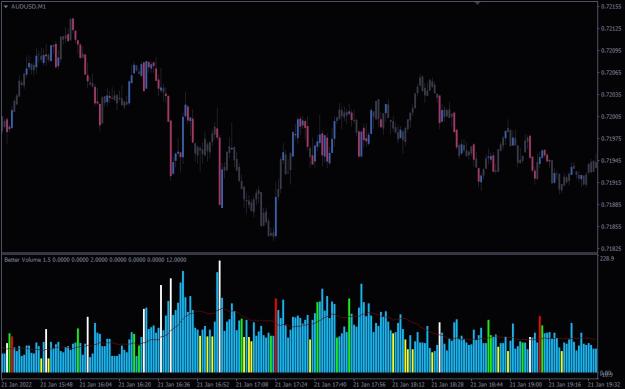
The indicator displays the volume of the market in blue, yellow, green, red, and white colors of vertical bars. The bars are painted in response to different conditions like neutral volume, low/high volume, climax churn, and climax up high/down high volume.
The blue bar painted by the indicator depicts that the market is trading at a normal volume. In other words, it implies that the trend is quiet and relatively stable. The bar also suggests that the market may likely continue to trend in that direction for a while.
The yellow bars signify that the trading volume is low. This bar is typical for having short height which shows that the trend is approaching an exhaustion point. They are also painted to suggest the end of market retracement.
The green bar depicts a large volume in the market. The bar is in most cases printed when large hedge funds make important trading decisions which is sometimes followed by a change in the trend direction. The trend reversal may not always happen immediately though.
The red bar on the other hand signifies a bullish market bias; it shows that buyers are dominating the sellers in the market. The red bar is usually followed by a change in the trend usually from bearish to bullish or a strong bullish retracement in most cases.
The white bar is closely related to the red one as they both play similar roles. However, the white bar signals a bearish sentiment. It shows that the sellers are firmly in control of the market. Appearance of the bar is sometimes followed by a trend reversal to the downside or a possible strong bearish retracement.
Conclusion
The Better Volume indicator is carefully designed and integrated with fundamental data to help you your own trading strategy. It gives you a clearer perception of the volume of the market to make better trading decisions. What’s more, the indicator is also built with a Simple Moving Average to define the height of each bar of volumes being printed
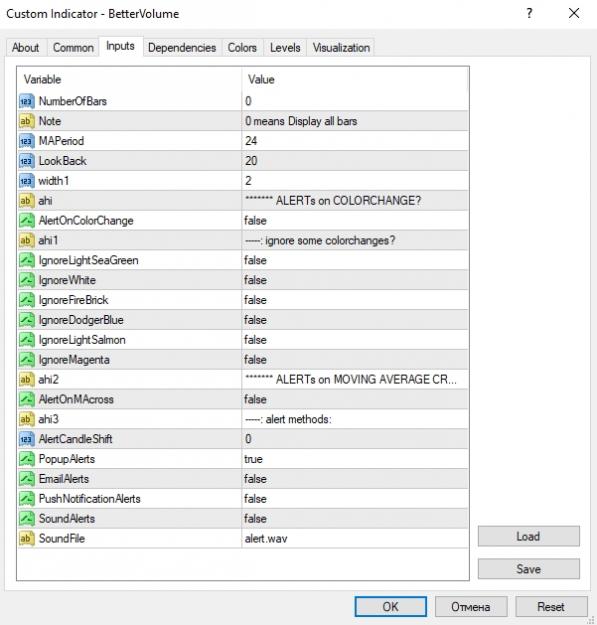
Indicator installation
Download Link
1. Download and unzip the archive to the MQL4 folder of the terminal;
2. Restart the terminal and run the indicator;
3. Allow import of DLLs.
Volume is an important deciding factor in the forex market. It is a function of different trading activities (fundamentals and technical) that take place in the market.
The indicator can come in handy for interpreting trend and volume of the market. This is because the Better Volume indicator is built in line with the market volume algorithm to keep close track of the continual volume changes in the market.
No system can accurately keep track of the fluctuations in the forex market, the Better Volume indicator isn’t an exception. But the indicator’s signals are good enough to rely on though.
As a forex trader, you’ll find this indicator very useful in your day-day trading analysis. It helps you to define the trend of the market, clear-cut reversal levels, and to anticipate pullbacks. You don't need to crowd your trading dashboard with all sorts of volume indicators because this indicator is well optimized to interpret volume.
The Better Volume Indicator Signals
Attached Image (click to enlarge)
The indicator displays the volume of the market in blue, yellow, green, red, and white colors of vertical bars. The bars are painted in response to different conditions like neutral volume, low/high volume, climax churn, and climax up high/down high volume.
The blue bar painted by the indicator depicts that the market is trading at a normal volume. In other words, it implies that the trend is quiet and relatively stable. The bar also suggests that the market may likely continue to trend in that direction for a while.
The yellow bars signify that the trading volume is low. This bar is typical for having short height which shows that the trend is approaching an exhaustion point. They are also painted to suggest the end of market retracement.
The green bar depicts a large volume in the market. The bar is in most cases printed when large hedge funds make important trading decisions which is sometimes followed by a change in the trend direction. The trend reversal may not always happen immediately though.
The red bar on the other hand signifies a bullish market bias; it shows that buyers are dominating the sellers in the market. The red bar is usually followed by a change in the trend usually from bearish to bullish or a strong bullish retracement in most cases.
The white bar is closely related to the red one as they both play similar roles. However, the white bar signals a bearish sentiment. It shows that the sellers are firmly in control of the market. Appearance of the bar is sometimes followed by a trend reversal to the downside or a possible strong bearish retracement.
Attached Image (click to enlarge)
Conclusion
The Better Volume indicator is carefully designed and integrated with fundamental data to help you your own trading strategy. It gives you a clearer perception of the volume of the market to make better trading decisions. What’s more, the indicator is also built with a Simple Moving Average to define the height of each bar of volumes being printed
Indicator installation
Download Link
1. Download and unzip the archive to the MQL4 folder of the terminal;
2. Restart the terminal and run the indicator;
3. Allow import of DLLs.