OK... I admit it... I don't have a complete theory rather it's more like a hunch. I think prices move in a swing like electricity does in a wire. But the reason we do not see a complete swing on charts is that we're seeing a distorted picture caused by induction of time in it. Therefore, conventional time charts are definitely not the way forward. For this theory to be successful, we need a chart which does not draw pips based on time rather, we need a chart which is drawn upon price movement only; Range charts are very useful in this regard but Renko and others are just as useful.
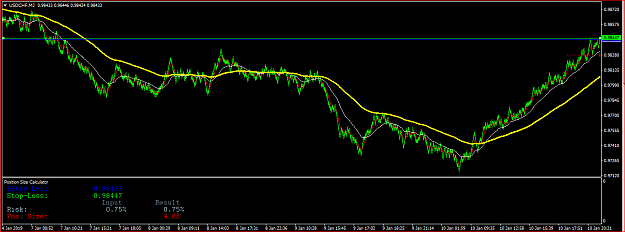
let's look at USD/CHF for an example. Now, why I've chosen USD/CHF is a story for some other time. Perhaps when I'll complete my theory. Meanwhile, let's look at the chart.
According to one theory: Technical studies essentially down to hunt for support in an uptrend) and for resistance (in a downtrend).
It's evident by just looking at the chart that a massive downtrend is imminent in a long run. I have simply installed an alarm at the support @.98343. As soon as the price closes below support, SELL this motherfucker and use the recent resistance @.98486 as a stop loss.
let's look at USD/CHF for an example. Now, why I've chosen USD/CHF is a story for some other time. Perhaps when I'll complete my theory. Meanwhile, let's look at the chart.
Attached Image (click to enlarge)
According to one theory: Technical studies essentially down to hunt for support in an uptrend) and for resistance (in a downtrend).
It's evident by just looking at the chart that a massive downtrend is imminent in a long run. I have simply installed an alarm at the support @.98343. As soon as the price closes below support, SELL this motherfucker and use the recent resistance @.98486 as a stop loss.