Hi
I was having a conversation with another trader about how to account for spread volatility. He made a passing comment that it may cause some of the systems that he is involved in to test well but trade poorly.
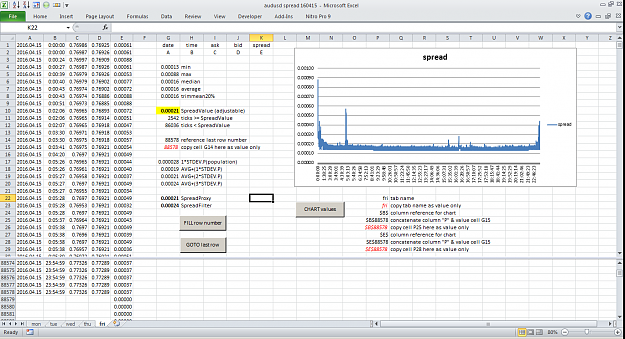
I did a comparison of spread between several brokers in live accounts. I collected the spread data over the course of some weeks to have a look at how the spread behaved. To do this I collected each tick with a timestamp and the bid and ask value. For this I used an indicator - TickDataCollector.mq4 which prints the information to a file.
I imported this data into excel and made a pretty graph. Like this one... audusd 160415.PNG
I have uploaded a zip file of screenshots for the audusd so you can see how the spread behaves for yourself.
bon apetite, Hermit
I was having a conversation with another trader about how to account for spread volatility. He made a passing comment that it may cause some of the systems that he is involved in to test well but trade poorly.
I did a comparison of spread between several brokers in live accounts. I collected the spread data over the course of some weeks to have a look at how the spread behaved. To do this I collected each tick with a timestamp and the bid and ask value. For this I used an indicator - TickDataCollector.mq4 which prints the information to a file.
I imported this data into excel and made a pretty graph. Like this one... audusd 160415.PNG
I have uploaded a zip file of screenshots for the audusd so you can see how the spread behaves for yourself.
bon apetite, Hermit
Attached Image (click to enlarge)
Attached File(s)