Hey Traders!
I want to introduce a really simple system without any need of interpretation or discretion.
You just need a H4 chart and the DeMark-indicator (attached). Don't change the parameters. Just use it as it is.
The entries (I only describe the long-entry):
If you see a red circle on the top of a bar, this is your entry-level.
You place a long order at the high of that bar + 4 pips + spread.
The stoploss is placed 3 pips under the last blue circle.
You only use the current red circle. If the last was not exceeded, ignore it.
The red circle shows a bar which has two bars with a lower high on the left side and two bars with a lower high on the right side. Therefore the circle appears eariest three bars back (because the indicator waits for two lower high-bars on the right side + the current bar).
Two possible exits:
1. Stoploss, which is a trailing stop
2. An exit after the next bar with a red circle appears (see the description below)
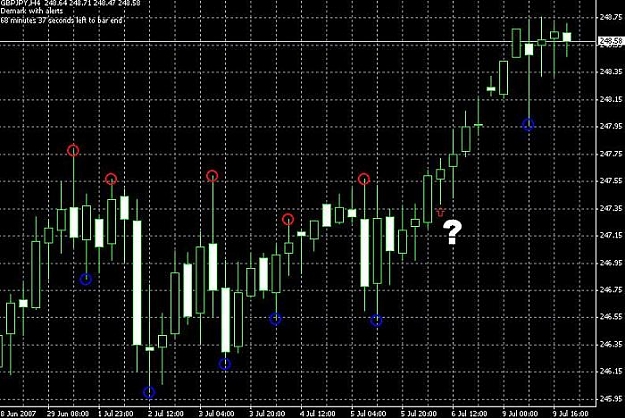
I think the best way to describe it is to look at the chart.
You see the the yellow check where the first bar with a red circle occurs. This bars' high is your entry-level. The circle appears on the bar with the yellow arrow which is also your entry-bar this time because it breaks the high of the red-circle-setup-bar. PLEASE REMEMBER THAT YOU ONLY SEE THE CIRCLES AFTER 2 FINISHED BARS!
Ok, now we are long. The initial stop is placed 3 pips below the last blue circle. The next bar is again a red circle bar (long setup bar) but we don't know it yet! The circle appears three bars later with the open of that bar. Now the exit rule: We wait for that bar to close and the trade is closed immediately with the open of the next bar. In this case it means that the trade is closed with the yellow-cross-bar. One bar before you see that the the very long bar has a red circle (it is marked with a light blue check) and then the trade is closed at the next bars' open.
This time it looks stupid because we close the old trade and go long again. The light blue checked bar is a long setup bar and 4 pips (+spread) above it a long trade is triggered. This trade is pretty good as you can see the next red circle is at the very high and we don't need to get out before. We move the stop to each new blue circle as soon as they appear. In this case you see the light blue cross on the bar where we are stopped out. Exactly the open of this bar made the blue circle three bars before visible and our stop was moved to this position. Now we are flat.
But this time we have a short setup. The white check shows you the first short-setup. 4 pips below the low of that white checked bar a short trade is placed. So we get stopped out (3 pips below the short setup bar) and reverse the position here (4 pips below). Now we are short and the red circles are only used for the stops. So our initial stop is above the very high.
Unfortunately there is a new blue circle directly at the low of our entry-bar. But we can see that three bars later. The exit rule says that I have to wait for the close of the current bar and close that trade with the next bars' open (white cross). That was a small loss.
I hope I could explain the idea how it is stucked in my crazy brain... ;-)
I would be really thankful if anyone could make an Expert Advisor for that because it is 100% mechanical. Further I would like to test some other parameters. Maybe the system works better if DeMark's parameter LevDP is set to 3,4,5,6... instead of 2. But remember that if you use e.g. 5 for the LevDP then you can see the circles not after three bars but after 6 bars! The LevDP defines how many bars must have a lower high to the left AND TO THE RIGHT SIDE! If you can code an EA, please consider that!
It can also be possible that it is better to use 6 pips as the buffer to place a trade instead of 4 pips what I described here.
That's it! Comments, ideas and help are appreciated!!
more
Great detailed information about the DeMark-indicator from hanover can be found in this thread: http://www.forexfactory.com/showthread.php?t=37073
I want to introduce a really simple system without any need of interpretation or discretion.
You just need a H4 chart and the DeMark-indicator (attached). Don't change the parameters. Just use it as it is.
The entries (I only describe the long-entry):
If you see a red circle on the top of a bar, this is your entry-level.
You place a long order at the high of that bar + 4 pips + spread.
The stoploss is placed 3 pips under the last blue circle.
You only use the current red circle. If the last was not exceeded, ignore it.
The red circle shows a bar which has two bars with a lower high on the left side and two bars with a lower high on the right side. Therefore the circle appears eariest three bars back (because the indicator waits for two lower high-bars on the right side + the current bar).
Two possible exits:
1. Stoploss, which is a trailing stop
2. An exit after the next bar with a red circle appears (see the description below)
I think the best way to describe it is to look at the chart.
You see the the yellow check where the first bar with a red circle occurs. This bars' high is your entry-level. The circle appears on the bar with the yellow arrow which is also your entry-bar this time because it breaks the high of the red-circle-setup-bar. PLEASE REMEMBER THAT YOU ONLY SEE THE CIRCLES AFTER 2 FINISHED BARS!
Ok, now we are long. The initial stop is placed 3 pips below the last blue circle. The next bar is again a red circle bar (long setup bar) but we don't know it yet! The circle appears three bars later with the open of that bar. Now the exit rule: We wait for that bar to close and the trade is closed immediately with the open of the next bar. In this case it means that the trade is closed with the yellow-cross-bar. One bar before you see that the the very long bar has a red circle (it is marked with a light blue check) and then the trade is closed at the next bars' open.
This time it looks stupid because we close the old trade and go long again. The light blue checked bar is a long setup bar and 4 pips (+spread) above it a long trade is triggered. This trade is pretty good as you can see the next red circle is at the very high and we don't need to get out before. We move the stop to each new blue circle as soon as they appear. In this case you see the light blue cross on the bar where we are stopped out. Exactly the open of this bar made the blue circle three bars before visible and our stop was moved to this position. Now we are flat.
But this time we have a short setup. The white check shows you the first short-setup. 4 pips below the low of that white checked bar a short trade is placed. So we get stopped out (3 pips below the short setup bar) and reverse the position here (4 pips below). Now we are short and the red circles are only used for the stops. So our initial stop is above the very high.
Unfortunately there is a new blue circle directly at the low of our entry-bar. But we can see that three bars later. The exit rule says that I have to wait for the close of the current bar and close that trade with the next bars' open (white cross). That was a small loss.
I hope I could explain the idea how it is stucked in my crazy brain... ;-)
I would be really thankful if anyone could make an Expert Advisor for that because it is 100% mechanical. Further I would like to test some other parameters. Maybe the system works better if DeMark's parameter LevDP is set to 3,4,5,6... instead of 2. But remember that if you use e.g. 5 for the LevDP then you can see the circles not after three bars but after 6 bars! The LevDP defines how many bars must have a lower high to the left AND TO THE RIGHT SIDE! If you can code an EA, please consider that!
It can also be possible that it is better to use 6 pips as the buffer to place a trade instead of 4 pips what I described here.
That's it! Comments, ideas and help are appreciated!!
more
Great detailed information about the DeMark-indicator from hanover can be found in this thread: http://www.forexfactory.com/showthread.php?t=37073
Attached Image
Attached File(s)