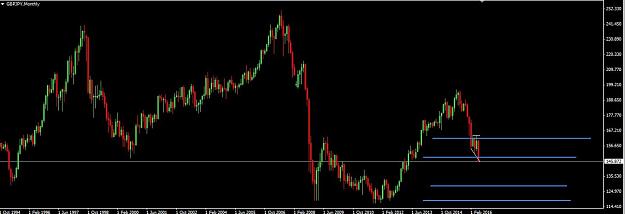
Just for fun, I set about trying to figure out where Cable supports would be in the event of a large, fairly uncontrolled fall. Over 24/25 years, Cable has operated within 5 primary support/ resistance bands that have been used repeatedly over that time. These are referenced off monthly charts going back to 1992.
1. Firstly, the initial drop commences at around 1.405 ~1.40.
2. Apart from the horizontal supports of 1.385 and 1.35x, next is 1.33. The first two are not primary support points.
3. 1.29, 1.26, 1.22
4. 1.08 (extrapolated only, based on some existing data only going back to 2008)
5. 1.00 (extrapolated only, based on very limited data)