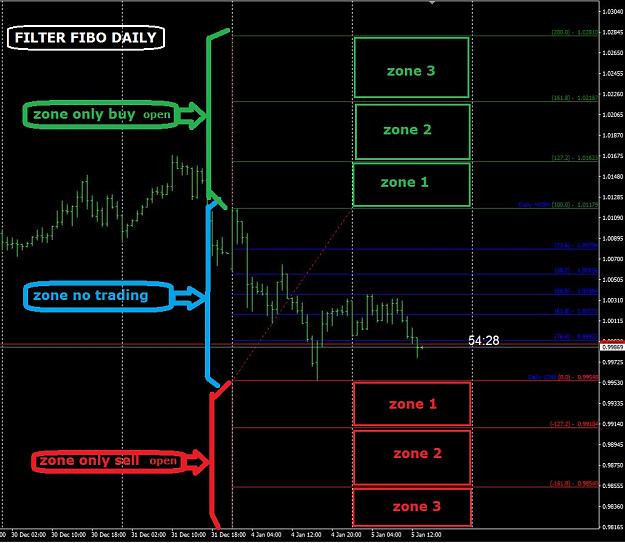
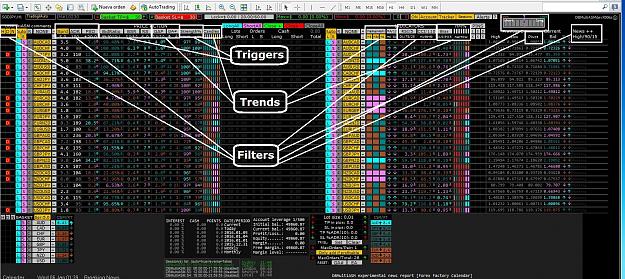
DislikedHi Aeseme, I think this can help to insert the pivots in the Dasboard The pivots points would put them in the group of filters. Use the same format HeikenAshi indicator. The pivots that would use daily weekly and monthly. Green when in buy zone. Red when in sell zone. They should be able to activate i disable zones.(time and price) DR1, DR2, DR3 and DS1, DS2, DS3(Daily support and resistance) WR1, WR2, WR3 and WS1, WS2, WS3(Weekly support and resistance) MR1, MR2, MR3 and MS1, MS2, MS3(Monthly resistance and support) White when in overbought and...Ignored
Have you already read the #Post 1 of this thread yet?