Joined Nov 2010
|
Status: Snaggin' Some Pips
|2,157 Posts
Cyber 1 has written a nice indi for my use. It shows all orders that are currently open that have not been moved to BE. Very useful when your employing the Equity Millipede strategy.
just finished installing this... so many bright colors!
Just from looking at this indicator, you could almost just enter every time green crosses red on the daily. With proper mm I bet it would still be very profitable.
Joined Nov 2010
|
Status: Snaggin' Some Pips
|2,157 Posts
Recent price action has brought to lite a problem with a portion of this strategy. Perhaps with input from others we can see a way around.
There having been many signals yesterday and today that have hit s/l. That in itself doesn't necessarily bother me as that is going to happen with any system.
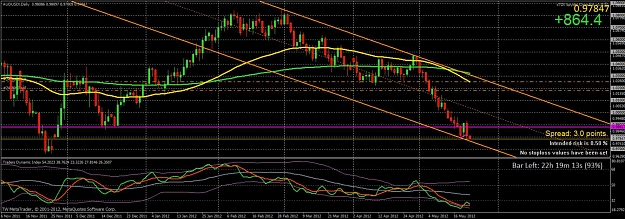
But notice the chart on the daily A/U. I had a nice stack going to the short side. Zooming way out on the weekly we can see that price action was toward the top end all time for the pair.
I got a daily signal in the opposite direction so diversified some positions and too a long trade. That trade then hit s/l. Again no problem. Maybe it was just a very short retracement.
The problem is that now if the pair continues to the down side we want to participate. We may well be at the top of a years long slide to the downside. But looking at the TDI, due to the short retracement, we will not get a valid short entry signal as the green line is nowhere near the top of the bands. I am not going to miss out on a major move down so I have to come up with a solution to this as I'm sure it will repeat itself at other times.
Yes the e/u did hit the s/l. It's still a valid setup on the daily so in line with post #1 I'm still going to try and reenter on the H1.
Just a note:
Everyone feel free to ask any questions on any particular trades you saw or were wondering about, as I'm not going to update every trade on every pair. Just don't have the time and I didn't want this to be a trade journal.
Maybe there could be some rule about if the green crosses the red immediately back in the direction of the original trend, regardless of the blue lines, then one can continue to enter trades in the direction of the original trend. Especially a trend as strong as this has been?
Maybe there could be some rule about if the green crosses the red immediately back in the direction of the original trend, regardless of the blue lines, then one can continue to enter trades in the direction of the original trend. Especially a trend as strong as this has been?
Ignored
I tend to agree with you, although I would hesitate to call it a rule. It just demonstrates that it's difficult to have hard and fast "rules" on a strategy. It takes a level of participation on the part of us as "traders".
I tend to agree with you, although I would hesitate to call it a rule. It just demonstrates that it's difficult to have hard and fast "rules" on a strategy. It takes a level of participation on the part of us as "traders".
It will be a learning opportunity.
Ignored
And the trades could still go back in the direction of the signal. Hopefully there will be some decision during the US Session. I'm back in the original direction of the trends on eurusd, audusd, nzdusd, etc. Made 800 pips over night on multiple positions on the JPY pairs. Lucky me, my account is up 11% in 2 days of live trading... but that may change if the positions I currently have do not continue in the direction of the original trend.
Glad to hear you're having success dafox. I too am back short on a/u and g/u. Long on u/cad
Ignored
I'm long on u/cad too. Some slightly negative news came out for the cad about 30 min ago. Created a random news spike up and that was repelled by resistance that caused the first correction. I feel like it could go either way, but if it breaks that resistance, it should take off significantly. My sl's on all my trades are at the trendlines that the pairs have been following. Risking .5-1% per trade. We will see... If those trendlines break, I may enter in the opposite direction, but it's so choppy today. even the jpy pairs are becoming choppy again after the overnight short
So far, your system has produced great results just in this short time period working with it. Hopefully it continues to do so and gets even better!
For now twiddling my thumbs waiting on these positions. They may all just consolidate this week and wait for employment news out of the US on 1JUN...
Joined Nov 2010
|
Status: Snaggin' Some Pips
|2,157 Posts
For those who like Graeme's Equity Millipede philosphy, here's an Excel spreadsheet you may find useful.
I made it to keep a log of the trades that I "promote" to holding groups after diversification. It keeps track of the changing price and pip values.
You can of course modify the fields to suit your needs. I have placed on this one my first "leg" of AUD/USD that I "promoted" after my initial diversification.
To use properly you need to understand how to set up your MT4 to feed data to Excel (otherwise it won't update correctly). I know just enough to get this working for me but not really enough to teach anyone else.
That looks like a fantastic tool! I will have to change brokers to actually follow the millipede method...
I don't know much about linking excel to mt4 either though I'll do a search on ff for threads on the subject later.
Good news for the dollar on new homes sales. Hopefully this will be the push that starts the domino effect on the euru, g/u, and u/cad. Will have to see how the 1hr 4hr and daily candles close.
I don't know much about linking excel to mt4 either though I'll do a search on ff for threads on the subject later.
Ignored
What I can tell you is that you have to enable the dde server on MT4 under Tools - Options - Server.
Once that's done open up the excel file. The only formula dependent on MT4 is in the "Current Price" column...column H.
The formula calls for the program MT4 to get the latest price. Sometimes you have to fool around with that to get it to work with your platform. Sometimes putting 'MT4' with the quotes helps.
wow, I wish I had mt4 mobile or was at home to access my account. I would have stacked more positions on these winners. I had 2-3 positions on each of these (e/u, g/u, aud/u, nzd/u, u/chf) and my gbp/aud looks to be doing well too. eur/aud is choppy.
Oh well, I'm just starting back at trading, so I must not get greedy or break my rules. lol, anyways, good day for us!
I just exited all my trades for +500 some pips (had to call my wife to do it for me at home!!). (I'm more of a day trader for now, but very interested in this trading method. No valid signals yet tho). Will backtest this weekend.
Hi Spyderman, I have read the thread twice and set the template up.
I see on the Eur/Gbp daily chart TDI green went outside the Orchid bands and crossed back down over the Red line signalling a short trade.
Do you wait for the D1 candle to close before opening the position?
S/L looks to be about .8103, is that where you see it?
Ignored
Mine hasn't shown the green crossing red yet, but that is probably just due to different brokers having different daily candles. You have the right idea though. I did enter that trade (a little early though)
Spyderman,
With regards to reversing signals on the daily chart, you may consider Malone's use of the Market Base Line in his TDI. Perhaps, reversal is confirmed when price crosses this level.
"Yellow line trends up and down generally between the lines 32 & 68. Watch for Yellow line to bounce off these lines for market reversal. Trade long when price is above the Yellow line, and trade short when price is below."
Regards,
cballew
Ignored
Possible, but that would put us in pretty late on a trend move.