Hello AlanI felt bad about the discrepancy so i am reposting the zipped file for you.
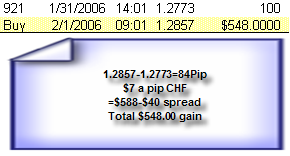
Attached is a picture of one random trade with the logic that the system uses. To calculate the profit.
Hello AlanI felt bad about the discrepancy so i am reposting the zipped file for you.
Attached is a picture of one random trade with the logic that the system uses. To calculate the profit.
Ignored
No need to feel bad. I've been there myself more times than I care to remember
I won't be able to get started on programming this until Monday for a comparison.
Do you know what the difference is between applying the time filter as stated and running it continuously. Does it reduce the profit a lot?
Does it work for other currencies?
Sorry for asking so many questions, so only answer if you have time to run the tests.
By applying a time filter net profit is $44,701 with a profit factor of 1.379
Without the time filter net profit is $114,062 with a profit factor of 1.239
So as you can see, the system is correct, more often with the time filter on but trades a lot less and net profit falls substantially.
As far as other currencies. The system is more or less only effective on the Swiss franc. I would not trade any other currency. I have managed to make the British pound and the euro profitable with the system. But with my modifications.
I understand modifying the system is not very popular, but the one-hour system on other currencies needed to be change slightly to increase the profit factor.
And no I did not use lagging indicators. I did modify the system so that I can recognize certain candle combinations, and only trade if it has broken a Demark trendline before crossing the tunnel. This seems to have cut out a lot of the false moves.
As far as asking questions asked away {read my signature}
A truly wise man, always has more questions than answers.
Allen your questions made me run a few more tests on different currencies. There is some value to the time filter on the euro. The Canadian loony, and the British pound. But not so on, the Swiss franc.What charting package do you use I would not mind sharing my code with you.
Although I have a suspicion it's probably Metatrader
A truly wise man, always has more questions than answers.
A few questions:
1 - are we to totally dismiss the weekly chart under the VWB method?
2 - is the weekly chart a reasonable confirming entry for VWB?
3 - how often will we have a weekly in disagreement with the daily in signaling direction?
4 - or am I interpretting these charts and indicators incorrectly?
Ignored
Diallist's Question to Vegas (via email)
Bringing the VWB into consideration regarding the 4 hour model: Can the VWB daily chart be used as a complete and total replacement for the weekly trend indication, or is the weekly still useful and/or necessary? I ask, because I don't like the unreliability of the weekly trend and would just as soon ditch it entirely.
Vegas' Answer to Diallist (via email)
Yes, it can be a total replacement for the weekly values. Some people will still prefer the weekly values and that is still OK. I happen to think the VWB makes better calls "at the turn" than the weekly values.
Hi Norbecker...
I am an fx noob and the concept of "averaging down" does not sit comfortably with me as I understand it. Did you mean we should load-up more lots/contracts as the price heads away from the anticipated direction.
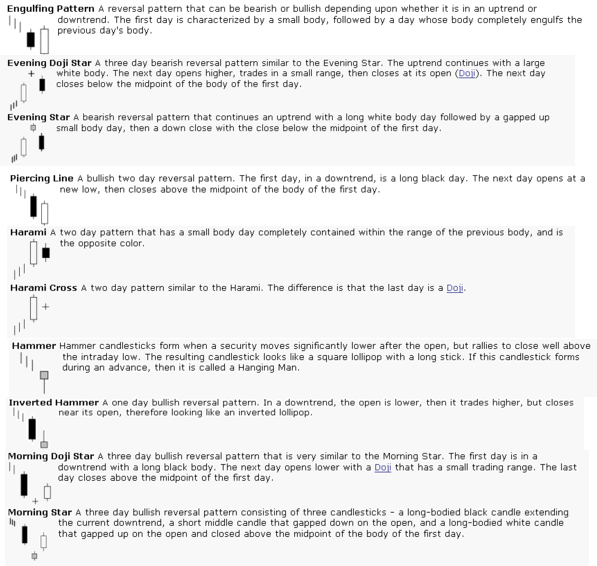
Also... for other noobs... attached is "common reversals - part I"
Hi all newbies. While waiting for Vegas vwb-II doc, I thought I would articulate my own naive trading methology for others to comment on. I am working towards having 3 trading strategies defined and learned and practiced.
1. Trading pullbacks in a trending market (maybe vegas 4h)
2. Trading extremes in a ranging market (maybe vwb II)
3. Trading major news releases (my own straddle strategy)
To this end here is my strategy for no. 3 above (see attached image)
(a) Prior to news I draw price channel in yellow so I have an idea where the price will probably return to after news activity.
(b) Prior to news I draw opening channel in purple (H and L of the day).
(c) I place a buy-stop 12pips+spread above upper purple line
(d) I place a sell-stop 12pips below lower purple line
(e) stop-loss are set at middle of purple channel
(f) profits are booked at reversal bars or 60pips (whichever occurs first)
(g) open a reverse position once price heads back towards yellow channel
(h) stop-loss set to recent news extreme for the day
(i) exit with profit near yellow channel
By applying a time filter net profit is $44,701 with a profit factor of 1.379
Without the time filter net profit is $114,062 with a profit factor of 1.239
So as you can see, the system is correct, more often with the time filter on but trades a lot less and net profit falls substantially.
As far as other currencies. The system is more or less only effective on the Swiss franc. I would not trade any other currency. I have managed to make the British pound and the euro profitable with the system. But with my modifications.
I understand modifying the system is not very popular, but the one-hour system on other currencies needed to be change slightly to increase the profit factor.
And no I did not use lagging indicators. I did modify the system so that I can recognize certain candle combinations, and only trade if it has broken a Demark trendline before crossing the tunnel. This seems to have cut out a lot of the false moves.
As far as asking questions asked away {read my signature}
Ignored
Thanks for answering the questions.
I must admit, I don't much look at the profit factor I'm initially more interested in the % drawdown. If you have a 'reliable' small % drawdown then you can just ramp up the trade size to a comfortable % drawdown and wait for the profit to roll in!
I can see actual figure of drawdown but I couldn't see % drawdown, which would be dependent on the maximum balance so far. Could calculate it manually though if it isn't given as a figure in the reports.
On the spreadsheets I downloaded
USDCHF 3pt spread -> net profit $190,970
USDCHF 4pt spread -> net profit $82,617
Over about 1000 trades (order of magnitude)
So for the sake of 1pip, it wiped off 55% of the profit.
If for whatever reason, the broker wriggled the price by 1 pip volatility, that could wipe out all the profit and put you at a loss. That seems like a very slim margin strategy.
Quick read of document to check currencies, "We trade GBP/USD, USD/CHF, and the S&P e-mini futures contract. Each has a specialty. Mine is GBP/USD."
So it should work on GBPUSD as well.
Am I right to understand that without the modifications of Demark trendline, trade only certain candle combinations, (also haven't read it thoroughly so so not sure if you changed the moving average bits), then the system is not profitable?
And, although the $ profit is higher without the time filter, the $ with the filter is more likely the return you are going to get if you traded it for real (unless you can trade 24/5!)
With a time filter, less trades are made so it could be that you get more pip per trade which gives a better 'comfort' factor, and hopefully a smaller drawdown.
Also for true testing, you need run your testing data that has not been used to optimize the system e.g. find the best case scenario for data up to 31/12/2004, then use those parameters to see what you would get for trading 2005 to simulate trading in the future.
I've heard that MT4 backtesting isn't reliable I use Amibroker, but I don't know how to integrate programming trendlines into a trading strategy. That bit is too complicated for me!
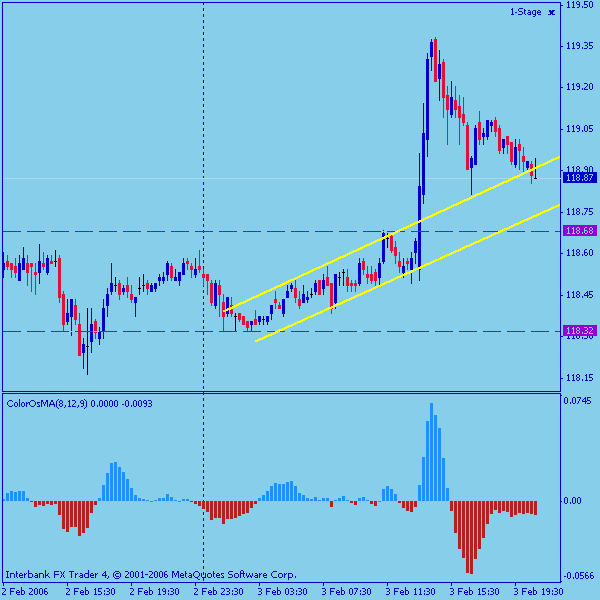
I could find a confluence of two trend lines at current high and see a "Piercing Line" reversal signal for the daily setup. I entered short @ 118.54 with SL at 119.55. I'm just demoing this now and learning my ways of finding the reversals.
Any comments are welcome.
Hi Norbecker...
I am an fx noob and the concept of "averaging down" does not sit comfortably with me as I understand it. Did you mean we should load-up more lots/contracts as the price heads away from the anticipated direction.
Also... for other noobs... attached is "common reversals - part I"
rjb.
Ignored
Adding more positions as price moves against you is exactly what I meant. I understand the logic and advantages of this strategy. That is also part of the strategy in Birdwatching in Lion Country. This can work when used with low leverage and skill. I will not do it myself as I just do not feel that......comfortable or confident in my skills in making those decisions under the pressure I feel when I end up in a negative position. So for me I know I am better off to cut my losses and wait for the next entry.
Forex Trading: The hardest way to make easy money.
Joined Jan 2006
|
Status: Monarch o' the Glen
|5,561 Posts
RJ, you said...
"
I am an fx noob and the concept of "averaging down" does not sit comfortably with me as I understand it. Did you mean we should load-up more lots/contracts as the price heads away from the anticipated direction.
"
A Very good metallity for an inexperienced Trader.
A question for your peers..
Do you Drive a car? If So, Can you pull a Footbrake 180 @ > 50 kph (30mph) while going in reverse and maintain momentum as you push it into 2nd? {yeah I know it's different with 4 wheel discs now}
The answer..
{i am making an assumption here} is probably...
No, I can drive, and I'm fairly good, but I'm not THAT skilled.
The effect of an uskilled Trader attemting "Dollar Averaging/Scaling In" would 99.9 % of the time have the same effect as a non "Skilled" driver attemting a full 180pull&Go... A TOTAL WRECK.
How can you tell? Ask yourself. Why did you Add? Comfort, or Fear?
If you missunderstood the signal the first time, you Better have a VERY GOOD reason to believe you are right this time.
I must admit, I don't much look at the profit factor I'm initially more interested in the % drawdown. If you have a 'reliable' small % drawdown then you can just ramp up the trade size to a comfortable % drawdown and wait for the profit to roll in!
I can see actual figure of drawdown but I couldn't see % drawdown, which would be dependent on the maximum balance so far. Could calculate it manually though if it isn't given as a figure in the reports.
On the spreadsheets I downloaded
USDCHF 3pt spread -> net profit $190,970
USDCHF 4pt spread -> net profit $82,617
Over about 1000 trades (order of magnitude)
So for the sake of 1pip, it wiped off 55% of the profit.
If for whatever reason, the broker wriggled the price by 1 pip volatility, that could wipe out all the profit and put you at a loss. That seems like a very slim margin strategy.
Quick read of document to check currencies, "We trade GBP/USD, USD/CHF, and the S&P e-mini futures contract. Each has a specialty. Mine is GBP/USD."
So it should work on GBPUSD as well.
Am I right to understand that without the modifications of Demark trendline, trade only certain candle combinations, (also haven't read it thoroughly so so not sure if you changed the moving average bits), then the system is not profitable?
And, although the $ profit is higher without the time filter, the $ with the filter is more likely the return you are going to get if you traded it for real (unless you can trade 24/5!)
With a time filter, less trades are made so it could be that you get more pip per trade which gives a better 'comfort' factor, and hopefully a smaller drawdown.
Also for true testing, you need run your testing data that has not been used to optimize the system e.g. find the best case scenario for data up to 31/12/2004, then use those parameters to see what you would get for trading 2005 to simulate trading in the future.
I've heard that MT4 backtesting isn't reliable I use Amibroker, but I don't know how to integrate programming trendlines into a trading strategy. That bit is too complicated for me!
Best regards
Alan
Ignored
Hello Alan
First The percent of drawdown Is under the tab Time it falls under the category equity curve.You'll see that it is 31.34%
Also the results that I posted Are the system not optimized at all They are using the moving averages that Vegas has provided.
The only difference as I mentioned before, was to prevent lots of wipspan trades I use the moving average of the high and the moving average of the low. You can see the settings under the tab settings there you will see the two moving average and two other parameters called nCon which stands for number of contracts. And another one called decimal. This is just to change it to a pair that would only have 2 decimals as compared to 4.
The British pound was not profitable, as written. You can make it profitable without the modifications but that requires changing the time of the moving average ((optimizing)).
I understand cautioned. When optimizing. I've gone through several different methods. One of which is optimizing a random 13 weeks and then taking the average.
But I now use separate software, which shows me a 3-D graph. And I able to pick the most robust parameters.
Another way I optimize is my perfect system method. I basically build a system that is perfect using a zigzag indicator. As you are aware. It is impossible to trade with the zigzag. It looks back and changes constantly, but it does build a perfect system. If you want it to. Of course this would be impossible to trade in real-time.
You then take every trade that the perfect system took and put them into an Excel file.
You run the system that you have built through optimization process and save the best 100. You then put every trade that this run-through's have taken and put them into an Excel file.
You then run a correlation analysis and take the parameters that most closely match the perfect system. I find this to be most effective for parameters that stay true into the future. This way, you can optimize over all of your data and still get parameters that produced a straight equity curve. And in my experience, have a much higher percentage of succeeding into the future.
A truly wise man, always has more questions than answers.
First The percent of drawdown Is under the tab Time it falls under the category equity curve.You'll see that it is 31.34%
Ignored
Thanks, it's the first time I've seen a Tradestation report!
Quoting Claude
Disliked
Also the results that I posted Are the system not optimized at all They are using the moving averages that Vegas has provided.
The only difference as I mentioned before, was to prevent lots of wipspan trades I use the moving average of the high and the moving average of the low. You can see the settings under the tab settings there you will see the two moving average and two other parameters called nCon which stands for number of contracts. And another one called decimal. This is just to change it to a pair that would only have 2 decimals as compared to 4.
Ignored
My mistake, I assumed you included Demark trendlines and candle formations as you mentioned them here "I did modify the system so that I can recognize certain candle combinations, and only trade if it has broken a Demark trendline before crossing the tunnel. This seems to have cut out a lot of the false moves."
Quoting Claude
Disliked
The British pound was not profitable, as written. You can make it profitable without the modifications but that requires changing the time of the moving average ((optimizing)).
Ignored
Very curious as Vegas reported he was trading it profitably. But he has said the market does change.
Quoting Claude
Disliked
I understand cautioned. When optimizing. I've gone through several different methods. One of which is optimizing a random 13 weeks and then taking the average.
But I now use separate software, which shows me a 3-D graph. And I able to pick the most robust parameters.
Another way I optimize is my perfect system method. I basically build a system that is perfect using a zigzag indicator. As you are aware. It is impossible to trade with the zigzag. It looks back and changes constantly, but it does build a perfect system. If you want it to. Of course this would be impossible to trade in real-time.
You then take every trade that the perfect system took and put them into an Excel file.
You run the system that you have built through optimization process and save the best 100. You then put every trade that this run-through's have taken and put them into an Excel file.
You then run a correlation analysis and take the parameters that most closely match the perfect system. I find this to be most effective for parameters that stay true into the future. This way, you can optimize over all of your data and still get parameters that produced a straight equity curve. And in my experience, have a much higher percentage of succeeding into the future.
Ignored
Sounds possible. I've no experience of doing it that way.
Hello firehorse, you mentioned that the latest VWBII has some very interesting ideas - where did you see this? I have been waiting for this - where is it located?
Joined Jan 2006
|
Status: Monarch o' the Glen
|5,561 Posts
Quoting fire580
Disliked
Hello firehorse, you mentioned that the latest VWBII has some very interesting ideas - where did you see this? I have been waiting for this - where is it located?
Hello firehorse, you mentioned that the latest VWBII has some very interesting ideas - where did you see this? I have been waiting for this - where is it located?
Thanks alot,
Ignored
Hi fire580,
All four of Vegas' documents, V1, V4, VWB & VWB II are located at: