Hey guys,
Here is a questions aimed at the big 4 (Strat, Alexandra, Elite Jets and Blackeagle) concerning dojis.
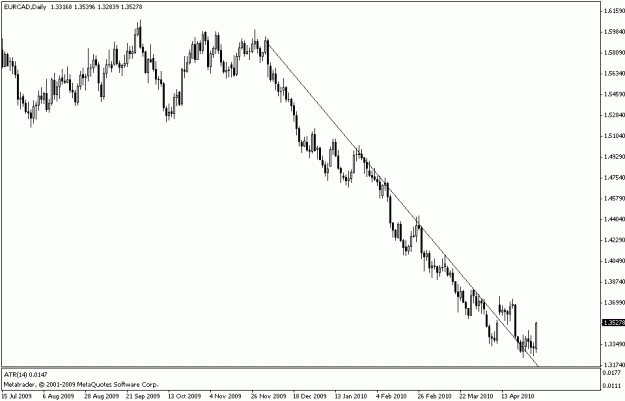
This last month produced some monthly/weekly high wave, spinning top, hammer and shooting star formations which depending on their position may or may not offer trading opportunities.
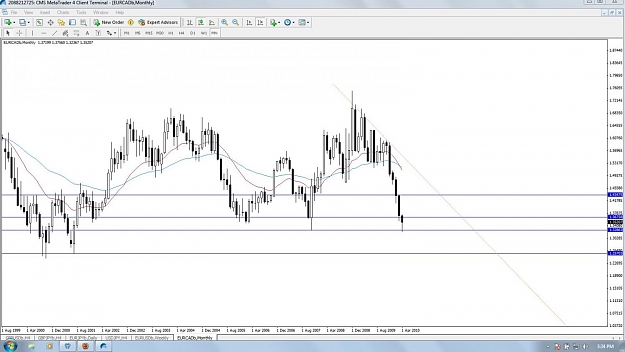
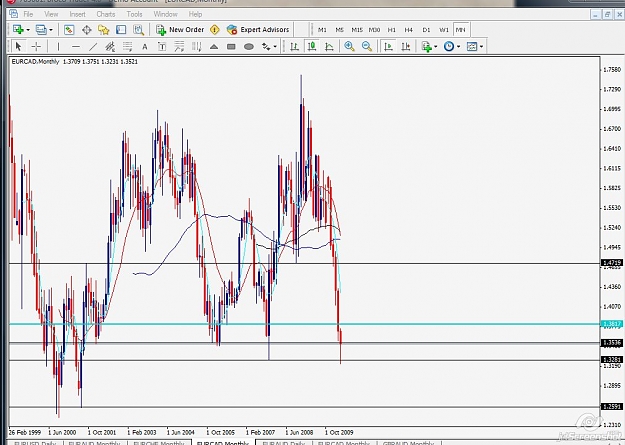
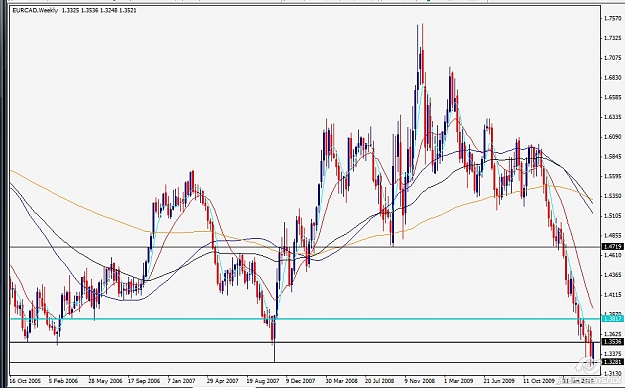
My limited understanding on this topic from reading previous posts is that these can indicate range or breakout/retest opportunities on the controlling monthly or weekly candles and that daily price can zip along within the range of the controlling candle for months until the extremes are breached and direction is established.
In short, I know there will not be a one size fits all solution but are there other standard strategies any of you follow when dealing with these candles other than looking for small PA candles at the extremes? Can we look to the OHLC of say a highwave formation as possible support and resistance areas to trade off of along with the static S&R on our charts?
Please don’t take this as a lack of trading discipline, I’m in no hurry to trade dangerous areas, I’ve just noticed that lots of big moves come off those monthly formations and would like to know how the professionals take advantage of these areas. If this is too advanced of a topic to be discussed at this time that’s OK too. Thanks for all your help.
Cheers.
John
Here is a questions aimed at the big 4 (Strat, Alexandra, Elite Jets and Blackeagle) concerning dojis.
This last month produced some monthly/weekly high wave, spinning top, hammer and shooting star formations which depending on their position may or may not offer trading opportunities.
My limited understanding on this topic from reading previous posts is that these can indicate range or breakout/retest opportunities on the controlling monthly or weekly candles and that daily price can zip along within the range of the controlling candle for months until the extremes are breached and direction is established.
In short, I know there will not be a one size fits all solution but are there other standard strategies any of you follow when dealing with these candles other than looking for small PA candles at the extremes? Can we look to the OHLC of say a highwave formation as possible support and resistance areas to trade off of along with the static S&R on our charts?
Please don’t take this as a lack of trading discipline, I’m in no hurry to trade dangerous areas, I’ve just noticed that lots of big moves come off those monthly formations and would like to know how the professionals take advantage of these areas. If this is too advanced of a topic to be discussed at this time that’s OK too. Thanks for all your help.
Cheers.
John
Finally out of the shadows.