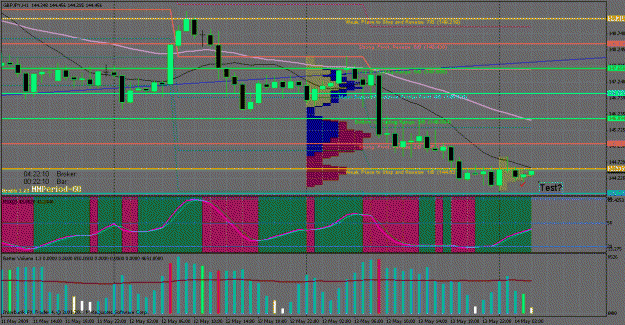
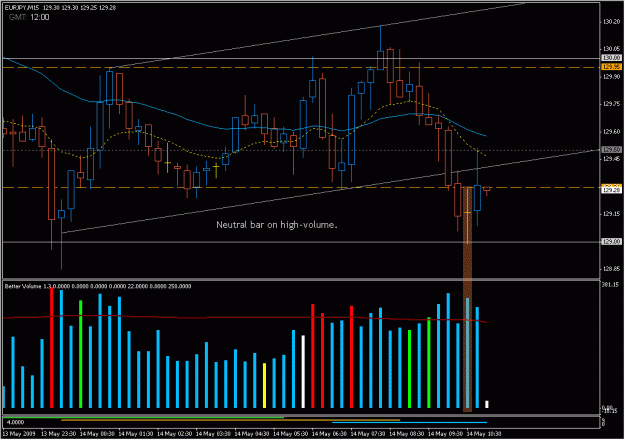
can some experts guide me here?
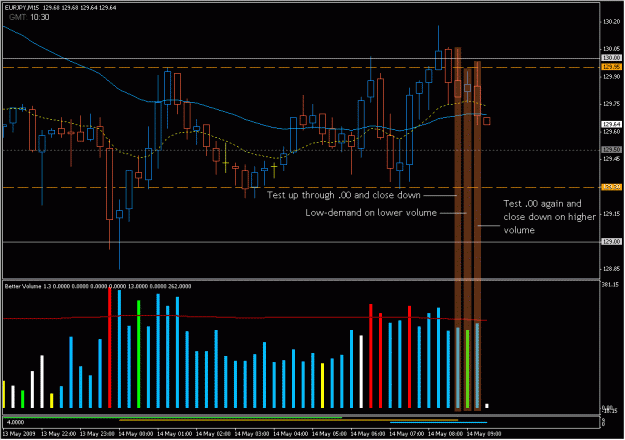
was this a test on low volume? no supply?
but i looked at lower TF. i see no demand. i am confused.
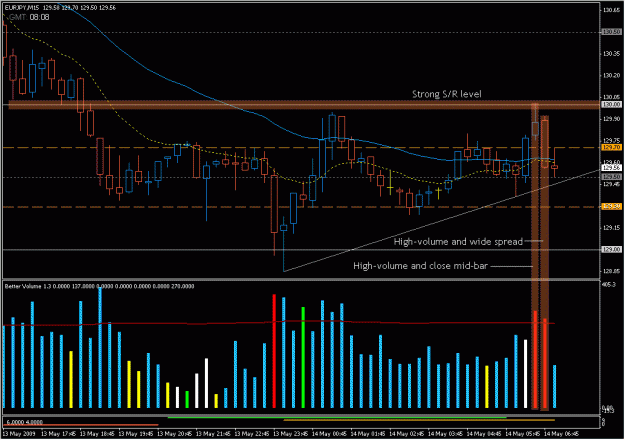
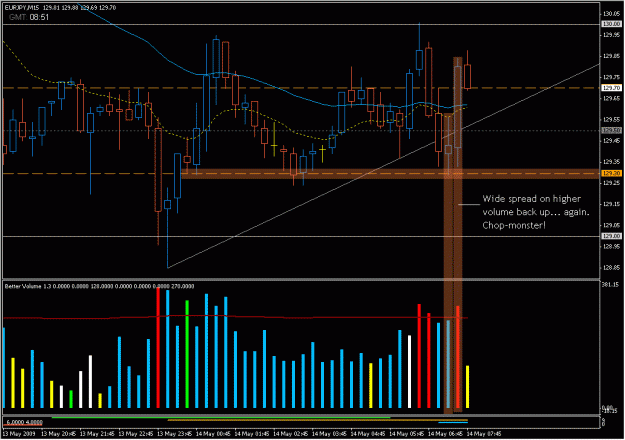
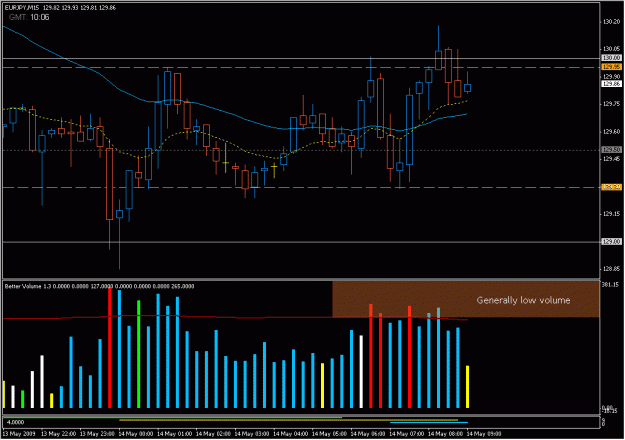
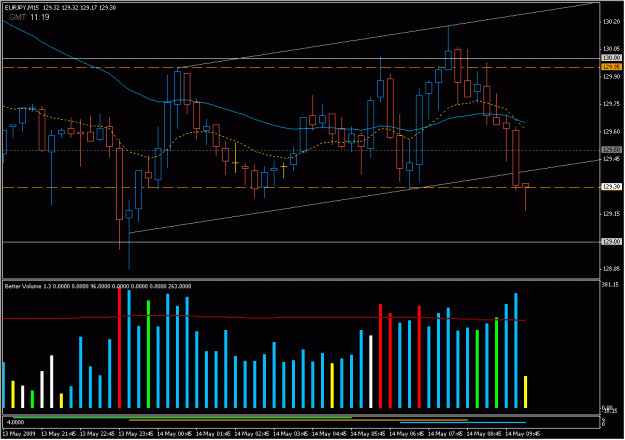
was this a test on low volume? no supply?
but i looked at lower TF. i see no demand. i am confused.
Attached Image (click to enlarge)