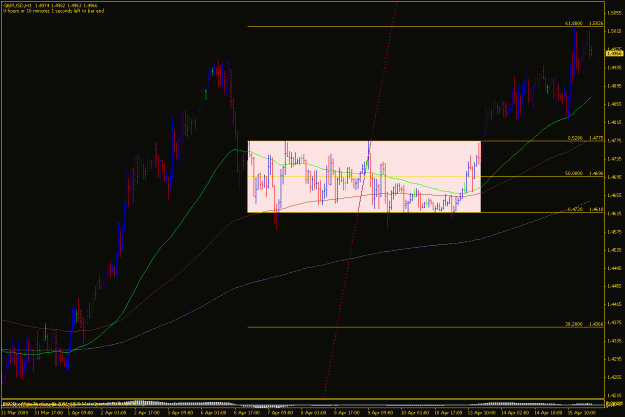
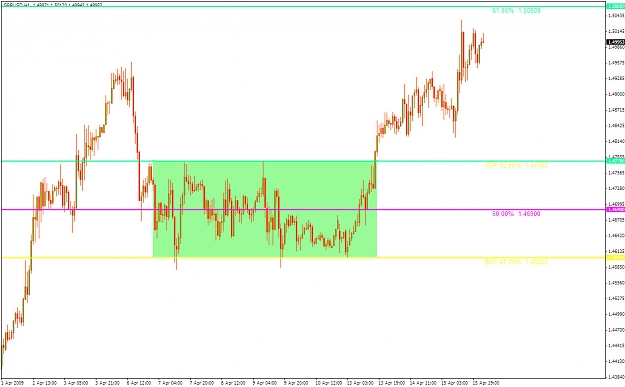
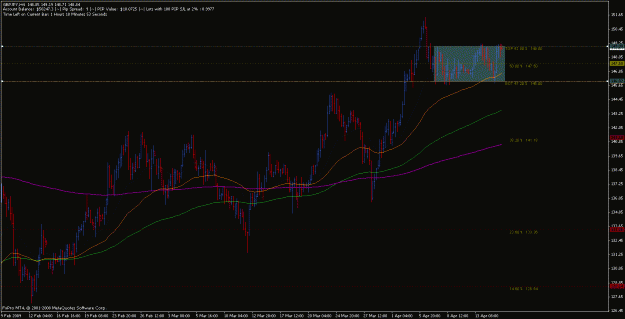
Breakout on the upper part of the channel occurring.
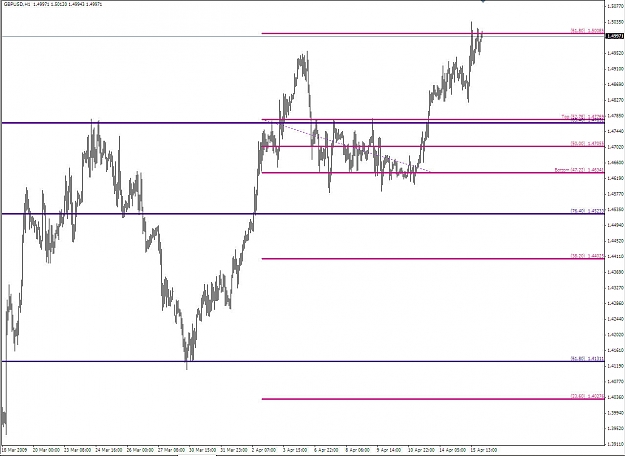
Let's see where we go. Looks like a first area of hesitation may occur at 1.4840 (Some bar highs just to the left.) Then on towards 1.500. Great confluence of the 61.8% fib and a big round number.
Wonder what will happen at 1.4950 first? Bar highs sitting right there, I suspect some trouble.
Maybe an eventual run to the next fib 1.5376 on this leg?
EDIT: Selling occurring at 1.4840-ish area. Just like the chart said it might. Watching....
Ignored
Redux
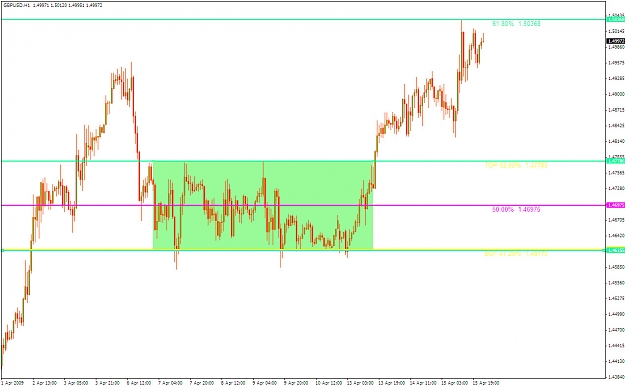
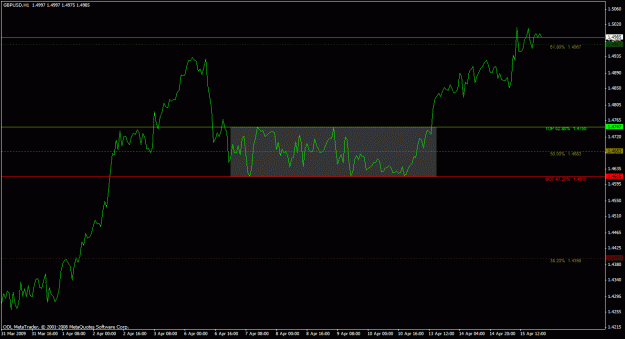
Here is today's chart on the same TF. It touched the 61.8 fib - completely by accident. <right>
Would you stay in it? At least have taken some profit and moved your stops? Uh huh. That's right.
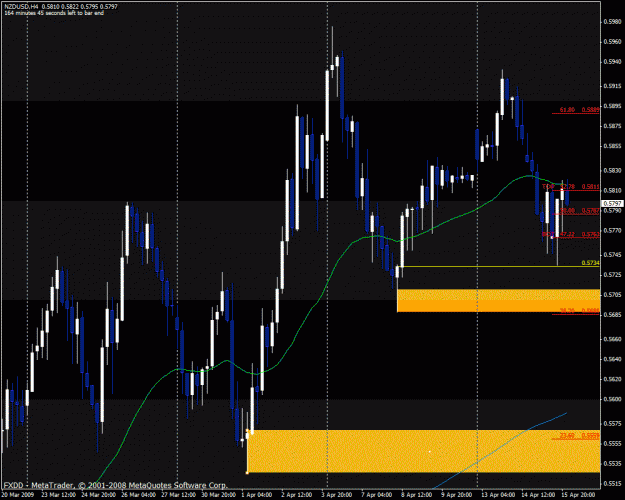
Alright I just woke up and seems like the market is rangin again in the audcad....I am now hoping they enter buy area. Hope they go pick up some sell stops so I can buy ...
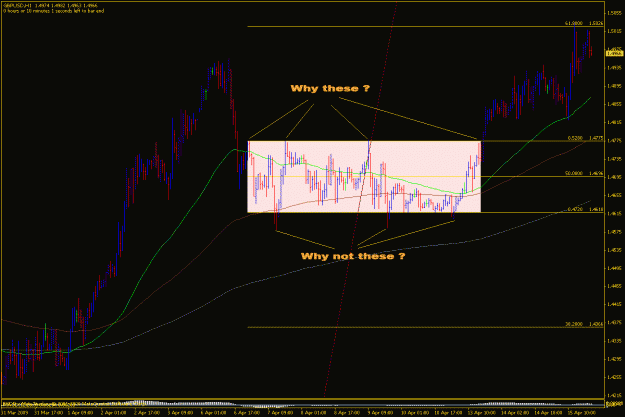
What are your critics to draw the channel, or do you draw them after fact?
That way you can adjust the fib's to allmost any level.
Ignored
Yeah - kind of like a redrawing indicator - except the operator is the re-drawer...
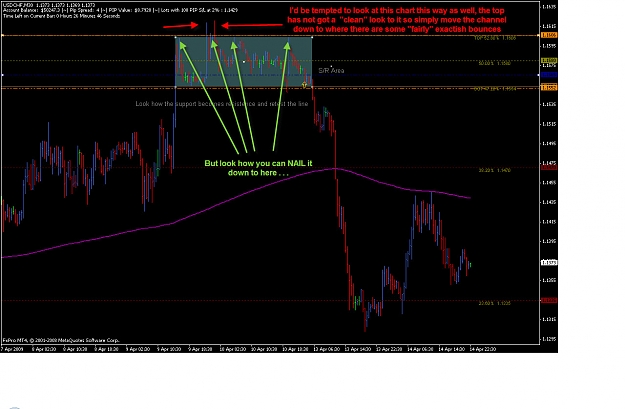
Seriously though - I saw a channel - I drew it in on the highs of it - they are nice and neat, and since the bottom was sloppy, I used a line graph to find where the bottom might go better. I did this Monday. See the attached line chart. Was this correct approach? Search me, but I have to do something that seemed reasonable.
I wish it were more sciency, but like Bemac and smjones point out, this ain't mechanical. What interests me is figuring out when it is time to draw a new channel, and more than that, learning to take low risk trades with this as a tool in the kit.
How do we discern a channel? Two highs and two lows? Maybe less if price is back in an old channel again.
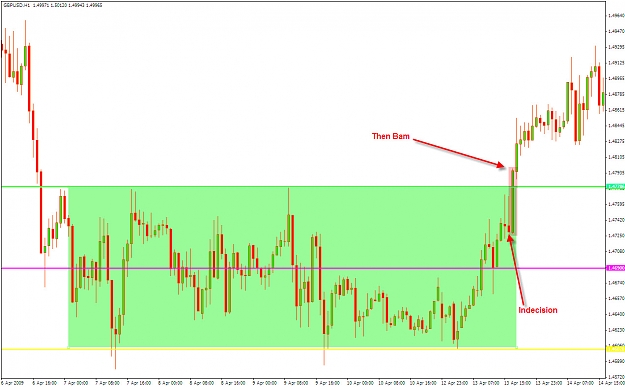
This is a good point you are showing on this chart. Without touching the chart of the 60-min time frame at all after I drawn the box on this range maybe 1-2 days ago; I came up with the same top and bottom of StoragePro. Now I'm not saying who's right and wrong. But speaking for myself, when I define the tops and bottom, I tend to go for top and bottom line that can describe the range in the best of manner. I remember my reasoning when I put that top line there; it's simply because I reasoned to myself, those are not spikes but have 3 distinct pivotal there; making them a triple top; and for the bottom line, I simply placed it the way I did because I think those two bottoms just couldn't be labelled at double bottoms when all those price clusters were forming good ranges above them. Take care
I remember my reasoning when I put that top line there; it's simply because I reasoned to myself, those are not spikes but have 3 distinct pivotal there; making them a triple top; and for the bottom line, I simply placed it the way I did because I think those two bottoms just couldn't be labelled at double bottoms when all those price clusters were forming good ranges above them. Take care
Ignored
Thats the EXACT way I looked at it as well, it's the same as the three discting pivotal point top on Chart 4.
I just could not nail down the bottem of it so I went to the most obvious area.
Also, SP did you actually see this one unfold and take it ? Or were you away from the computer at the time ?
Also in terms of "entry" I see this type of thing a lot cropping up in my visual backtesting . . .
Ignored
I saw it unfold. Although it would be a big honkin' lie to say I took the trade live... Too much to assimilate before I get comfy enough to trade this. I merely posted it.
I could see trading this after it went down, and came back - and cleared the 1.4800. And I would want PA too. But that is just me. I don't like traps.
What is of interest is the predictive nature of this tool so I can look for PA is great spots.
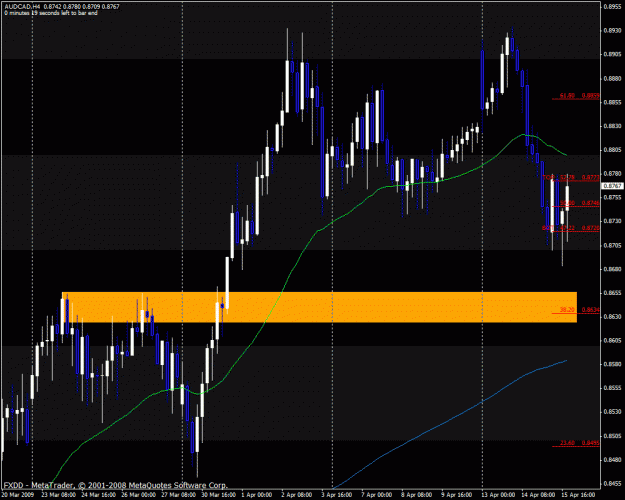
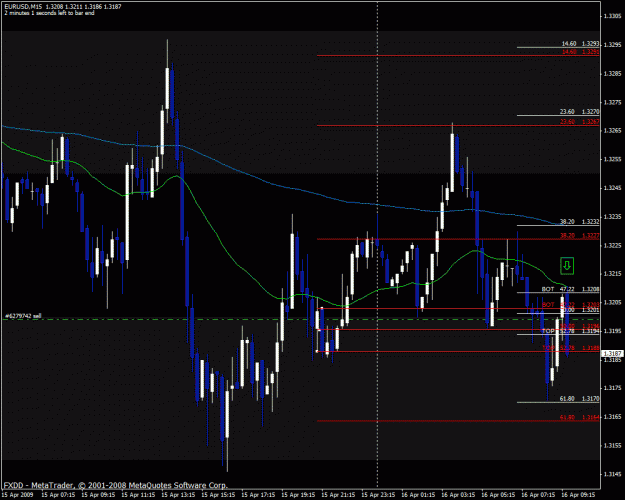
In case anyone cares, the breakout day yielded a BUOB. Not an A+, IMHO, but a BUOB none-the-less. It was not at a swing low, but at a minor pullback.
Joined Aug 2008
|
Status: Sharpen the Scalper Razor
|4,704 Posts
Hmmm, now I’m on the same as I’ve been before.
If I integrate a method in my trading system I need to be sure that I do it right.
I do not trade demo as I see it as financial porn and waste of time (for me), but I use a trading simulator to shorten the time while proving a system during non trading hours.
Some pips up or down in the channel drawings can make a huge difference in the fib positions and with that in my targets.
Failing my target can cause serious damage, even loss.
I’m with Scott and Bemac that the best systems aren’t strictly mechanical (for ex. THV isn’t) but if the base isn’t rock solid, there is no system.
And now?
I think I have to wait for more explanations and development of this great proyect, as Scott said.
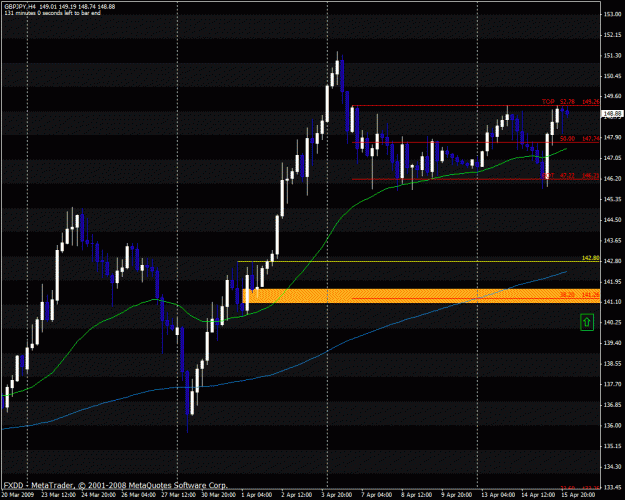
Yep thats a good one ...I am waiting for the market to breakout...once it breakout I will either way for a reteast of the range or I will buy the support below ...I am only intrested in longs in this pair since they hold more potential ....
Seriously though - I saw a channel - I drew it in on the highs of it - they are nice and neat, and since the bottom was sloppy, I used a line graph to find where the bottom might go better. I did this Monday. See the attached line chart. Was this correct approach? Search me, but I have to do something that seemed reasonable.
Ignored
That makes me even more confused; you say that it is reasonable to draw the highs with a candle chart and the lows with a line chart.
Wouldn’t it be reasonable, if you look on a line chart, to draw both, the upper and lower channel there?
That makes me even more confused; you say that it is reasonable to draw the highs with a candle chart and the lows with a line chart.
Wouldn’t it be reasonable, if you look on a line chart, to draw both, the upper and lower channel there?
Ignored
That's the way I've been doing it from the git-go. I drew my regular fibs that way before Bemac showed us ICCE. Plotting with lines [YES- BOTH HIGH AND LOW] gets rid of the noise. I won't do it another way.
That's the way I've been doing it from the git-go. I drew my regular fibs that way before Bemac showed us ICCE. Plotting with lines gets rid of the noise. I won't do it another way.
That makes me even more confused; you say that it is reasonable to draw the highs with a candle chart and the lows with a line chart.
Wouldn’t it be reasonable, if you look on a line chart, to draw both, the upper and lower channel there?
Ignored
Sure. I looked at that myself, and did not like the results. Bad feel to it. Seemed 'fake'.
But like you, I am feeling my way through this. So I do what is reasonable to me. Some believe the wicks do not matter because the opening and closing are the finish of the matter, and hence where the real business is. I have noticed when closes are grouped tightly together I need to take notice. The market is speaking.
Ah, but I wish it were so easy. The charts represent the activity of the crowd (my view of it) and crowds are a messy thing - leaving trash all over and drinking too much beer.
So how do I look at that particular chart? A nice even top = agreement over time. Jaggy, messy bottom = no agreement or perhaps failed forays to re-continue the trend down.
At any rate, the bars are nothing more than the representation of the order flow. I try to see it that way.
The time elements are the parts that are mysterious to me. Crowds can only go so long doing one thing, then they start drinking and fighting again and making a general mess of things.
Maybe Mr Fibonacci's work has application to this dimension?
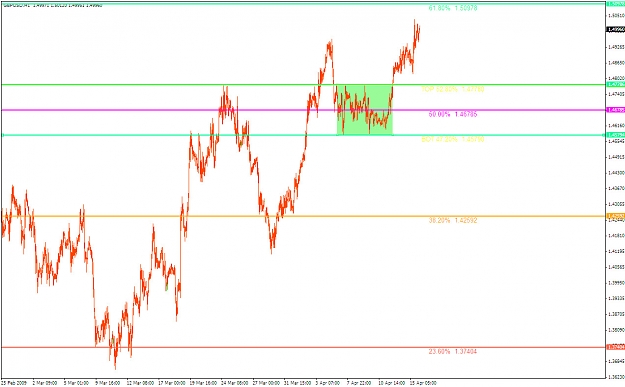
Call it beginners luck with this tool. It was dead nuts on for me.
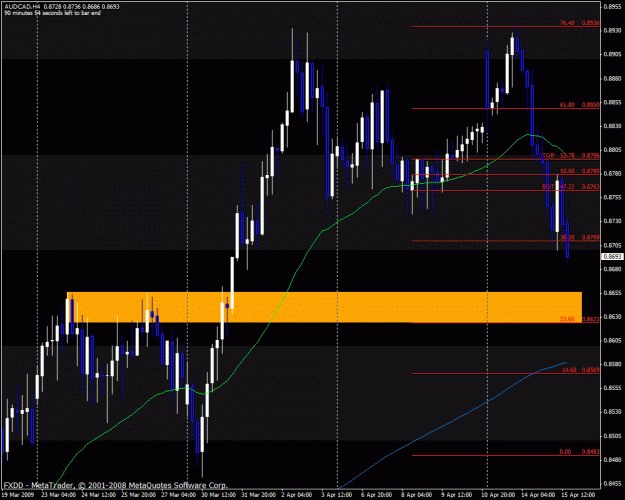
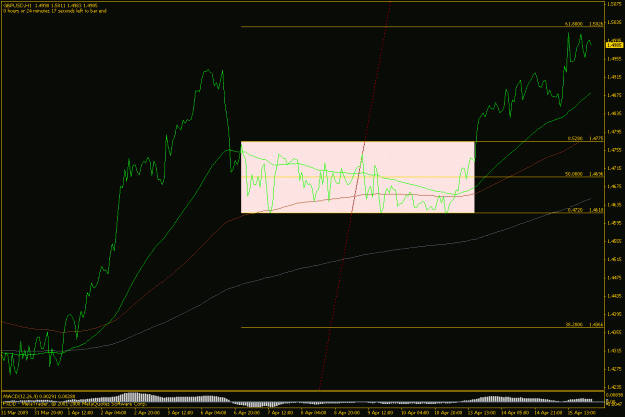
EDIT: The pair just broke above the 61.8 fib. Next marked spot 76.40 which coincides very neatly with a swing high of Jan 8, 2009 that forms a pivot with two long daily bar lows from 10-24-08 and 10-27-08. If price gets there, expect a retrace.
Ah, but I wish it were so easy. The charts represent the activity of the crowd (my view of it) and crowds are a messy thing - leaving trash all over and drinking too much beer.
Maybe Mr Fibonacci's work has application to this dimension?
firstly I am glad that iCCE is not mechanical because it would be replicated around the world faster than the spanish flu.
secondly i am restricting myself to the eur/usd to get a handle on it as the jpy crosses have a mind of themselves
thirdly, many years ago i was lucky to have some interaction with Prof Moran at Cambridge and his special interest was geometrical probablity. He argued that there was no such thing as an unbiased estimate of a measurement, rather the game was to measure the observer's bias in his estimate. So in this case, I am relaxed about getting the channel perfect, my experiment is to adjust channel parameters ( and record) when price has defined a rejection or overlap of a fib bar eg the 38.2 line. That then sets the other fibs up in a "tweaked" state. As price reaches out to 85% bar a further tweak is often needed, just a few pips, as you have noticed . At the least, its fun, at best it gives a view of target area which is nice.
( i use 5min line chart) ..the test goes on..
Alright the market has moved like I want I will now move to break even...if the market is not strong enought to hit my target now it simply means it was not a perfect setup. I only trade for those...like this tool . It goes with the way I already traded just confirms what I am seing.