The EUR/JPY broke through the 164 barrier, does this change your view on its direction? I ask because i remember you saying somewhere in this thread that once a line is broken thats it.
Cheers
Ignored
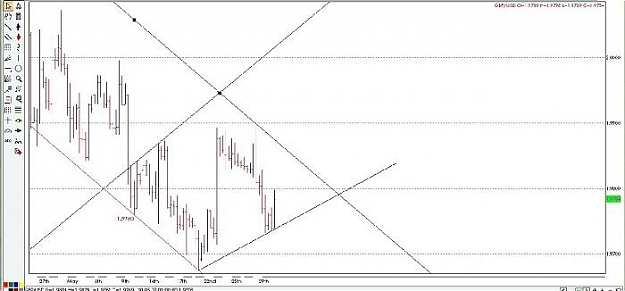
The meaning of my remark was that once a technical line gets broken, it loses its significance. It doesn't say anything about further actions. It might be a false break. There are some exceptions however but it's a long story to elaborate. However, in this case on the EUR/JPY it is not a technical line but rather an artificial level, important only for those who really believe in Fibo theory. I'm not one of those and my interst has been purely academic because of a rare situation have been taking place when you could witness so pure and unobscured opportunity to prove a theory on a very long term charts. Apparently it has failed once again. It doesn't say it will go up or down from here but rather proves that the Fibo theory is in fact more about theory than practice.
When u take a trade, do u plan the holding period beforehand ?
Let say u take a trade at weekly or monthly chart which is to ride out the yearly range.
U take the trade and plan the trade as it goes along in yr trade direction.. daily ??
Or u take the trade and let it be ??
Let say u take a trade at hourly chart which is to ride out the daily range.
Would u let the trade progress into a long term trade ?
Ignored
I usually plan the target in advance. Longer-term trades are not so easy to take. The market usually provides opportunity for such trades not more than a couple of times a year and very often I miss them. But sometimes I get lucky enough to take the enire annual range in just one trade. I did it a few times and liked it a lot. You've got to understand that trading business is not about figuring out in which direction the market will go but about composing a trading plan with all its attributes such as stops and targets for profit. Average weekly. monthly and yearly ranges just allow me to make reasonable target projections for each time frame.
|
Joined Mar 2007
|
Status: XXXX Trader
|318 Posts
Igrok,
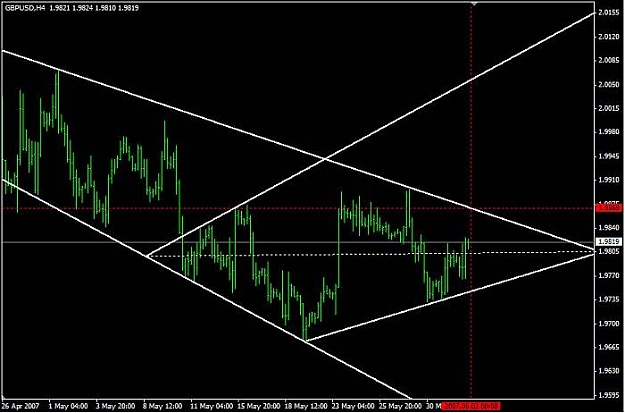
I would like your thoughts on this chart, is this a reasonable drawing? Its a current (as of the time it was posted) chart of 8Hr GBP/USD.
Thanks
Edit: I just realised i have replicated a chart you posted earlier in post #370.. And i thought i found my first diamond.. Well it was still satisfying!
Scrat,
nice image!
i was just coming to the thread and looking at the book trying to establish this as a diamond in a downtrend that has broken to the upside. i'm looking at volumes as well and i see we are due for a breakout most likely to the upside based on daily and weekly candles.
Really anxious for Igrok's response here.
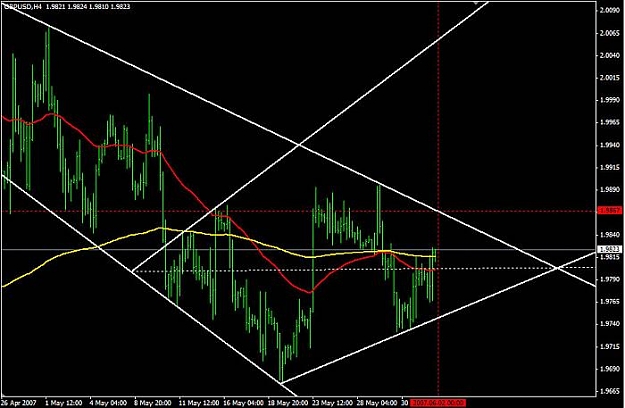
* note: the chart is identical to the one from #386, plus 50 & 200 emas.
----------
or we could look at it this way, see the pic below.
monday's high should be 1.9867, then downtrend resumes.
the pattern is briefly explained here (https://example.recognia.com/demo/serve.shtml?page=education&eventtypeid=63&ref=chart&sid=38Recogniademouser).
by the way, notice how 50 EMA (red) is below 200 EMA (yellow); although it points upwards and last candle closed above 200 EMA...
i'm very curious to hear Igrok's comment on this.
now, is this diamond pattern a reversal or a continuation? if it's a reversal, we can expect 2.0052 (at least) in the very near future; if it's a continuation, i'm thinking about 1.9530 - but that depends on the breaking point.
|
Membership Revoked
|
Joined Dec 2006
|2,771 Posts
Bingo! Seems I have not completely wasted my time here on the forum. Finally can see some pretty good progress made by some participants in learning basic TA patterns use. I like the pictures posted by several different contributors just recently. Congratulations.
Well, the upper border is likely to come on Monday anywhere between 1.9845 and 1.9867. The direction of the main diagonal is up, thus making the downward break more probable if everything goes as it is supposed to. Then about 220 pips should be the target for profit after the break (if to start calculations from the breaking point). In any direction. So, we will either see cable at 1.9530 ( if everything goes by the texbook scenario) or at 2.0080 (if for some reason cable will chose to make this diamond to be a reversal one).
P.S. Just a small notice. Whenever a serious technical trader outlines a pattern of draws a trendline, such line should never cross the chart somewhere in the middle. TA is in fact a very precise thing. Rough drawings are for pussies only.
thanks for the input.
i was expecting a breakout, from what i read it seems that price fills about 75% of the diamond and then breaks out. usually. this is not the case with this one, looks like cable is going to fill the entire contour.
i really want it to go down... that's probably why it's gonna go up.
Ignored
Your picture at #360 makes a lot of sense. In fact, much more sense than someone's idea about that 75% fill. Also, there is no need to want the market to do anything. Just go with it.
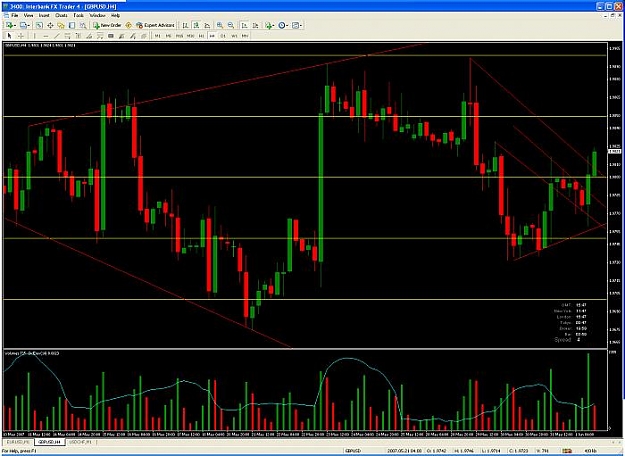
#360? hm... you mean, the first or the second chart? well anyway, my analysis would be the same based on those 2 emas.
sometimes i look at macd, and in this case i had to. 12,26,9 shows up in h1, h4 and d1. no clear direction yet.
Your picture at #360 makes a lot of sense. In fact, much more sense than someone's idea about that 75% fill. Also, there is no need to want the market to do anything. Just go with it.
#360? hm... you mean, the first or the second chart? well anyway, my analysis would be the same based on those 2 emas.
sometimes i look at macd, and in this case i had to. 12,26,9 shows up in h1, h4 and d1. no clear direction yet.
Ignored
Sorry. I meant #386. The other one makes no sense as it's drawn incorrectly.
now, is this diamond pattern a reversal or a continuation? if it's a reversal, we can expect 2.0052 (at least) in the very near future; if it's a continuation, i'm thinking about 1.9530 - but that depends on the breaking point.
Ignored
I have a question that only a rookie like me would ask about the chart posted.
I am not understanding how your lines, as the criteria used, are drawn. What is the reason for the one line being drawn on 5/8 and such to form the diamond?
Sorry if I missed this information if posted earlier.
I have a question that only a rookie like me would ask about the chart posted.
I am not understanding how your lines, as the criteria used, are drawn. What is the reason for the one line being drawn on 5/8 and such to form the diamond?
Sorry if I missed this information if posted earlier.
to save time and understand it is essential to read the book.
all chart formations are detailed in the book. the current topic is of a diamond forming on cable. we are considering a break up to the higher border of the major channel around 1.9870 early this week. I am cautious to carry traders flooding into the market on a green light from US inflation data that printed friday. US equities and carry trades are very strong now so bettering against them is nearly futile until the bulk of funds has found it's home for the near term in their instruments ie. gbpjpy, S&P500. this relates to cable because massive inflows to gbpjpy will influence cable with support.
if you have any questions about the book you can save time on the thread and IM me personally.
"Beat the Odds in Forex Trading" Igor Toshchakov (L.A. Igrok)
Amazon will allow you to read it online when you buy it. Barnes and Noble and other local retailers typically have 1-2 copies on hand.
Do you have any suggested reading material on diamond patterns that would be useful to read? I have been going through this thread and see that it is an effective TA tool. I've been a long time lurker of this forum and I think I read in a previous thread that you have an ebook available. Any help would be greatly appreciated.
thanks for the tip. looks like we'll get a bearish move after all.
oh, and about my chart, looks like my 200 EMA should have been a 200 SMA - this one is a better one. just thought it's worth being mentioned.