{quote} You almost made it to the EMA. I think it is just killing time and may go up on the next 1 hour bar.
Ignored
Yes, I also could had hedged there. Anyway, back to work. Its hard to trade from work with webtrader lol. Tonight I'll review today setups and study a bit. Take care all.
{quote} I wouldn't ignore a div but that is not to say I would take it, the inference was for the 1 hour to go for the EMA so I would not be looking to short these on the 5 min, if I get stopped out, too bad, but I wouldn't have lost anything.
{quote} A 2 bar test can help you avoid some div failure. Also remember than when a div fails to pull price to the ema, we can expect a lower low or a higher high. I have the same problem, we must have patience and wait for a good setup with the correct timing and on a ZOO level.
Ignored
Thanks hocius, I've read that countless times stated by Alan but for some reason it didn't really register until now. Also, could you possibly show where and how exactly you'd use the two bar test on the chart?
{quote} I know its difficult and making the same mistakes but in your charts i am missing some levels; in that area you traded short I have 3 H1 EMA swing levels in an uptrend; we know that when a divergence dos not get back the price across the EMA its a good sign the move will continue in its original direction, so further long. We had a H1 ZOO at 31022 and on the H1 and the M5 price ran into that area in a bull divergence, so at that point we are looking at 31207. Price ran up, crossed that level and retested it (and its M5 bull support bar)...
Ignored
Wow husky, this is extremely helpful. I didn't realize how much I missed, don't know how I missed those bullish divs given those seem to be the only part of this method I thought I had a good grasp on lol. I'm still trying to learn the ABCD and some of the other concepts and tbh I'm still digesting your analysis of the chart so I might bother you with a few questions on it later. Thank you.
{quote} Thanks hocius, I've read that countless times stated by Alan but for some reason it didn't really register until now. Also, could you possibly show where and how exactly you'd use the two bar test on the chart? {quote} Wow husky, this is extremely helpful. I didn't realize how much I missed, don't know how I missed those bullish divs given those seem to be the only part of this method I thought I had a good grasp on lol. I'm still trying to learn the ABCD and some of the other concepts and tbh I'm still digesting your analysis of the chart...
Ignored
No problem mate. I can't draw you a chart right now because I'm not at home. Check Post 4,652 for a couple of examples. Or you can search "2 bar test" on this thread for more examples. To be honest, I need to focus more on the 2 bar test also, but many times I'm afraid I'll lose the opportunity to get a good price.
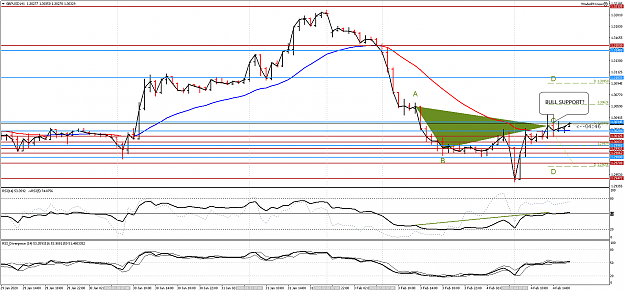
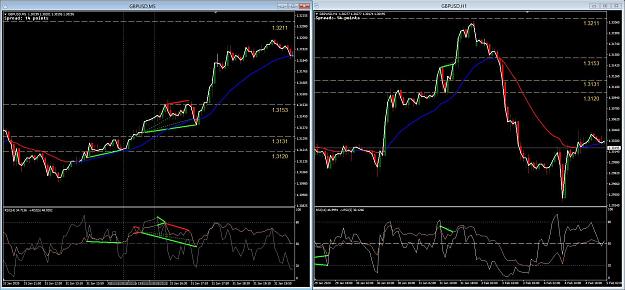
price projections H1 with B at the lowest RSI. I can't see it very clearly but I believe price made bull support. The bulls stopped the EMA from breaking the 3012, open space to the upper D @ 3095
price projections H1 with B at the lowest RSI. I can't see it very clearly but I believe price made bull support. The bulls stopped the EMA from breaking the 3012, open space to the upper D @ 3095 {image}
Ignored
Yeah, I'd say that's a bull support. I zoomed as much as I could and it seems it closed upside the ema
It would seem many are still having chart reading trouble, no problem I realise it takes time and study so if you are stuck just ask.
One thing that will definitely help is to make a study of the session and try to work out the particular events that happened. Then make a collection of print-outs for referencing. You can also write your own text to accompany the chart so when you read back a month or two you will find you are seeing the past in a different light because the light bulb turned on.
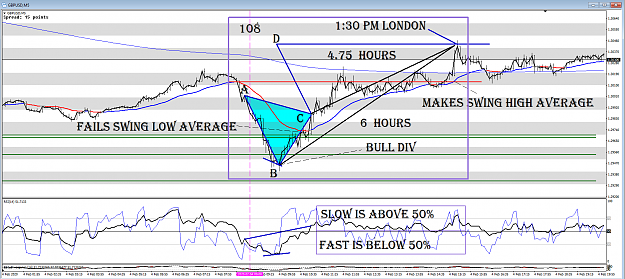
Below is an example of such a chart with the things we are keeping an eye on.
The text would read something like...
1) Bull div at B... Two bar test got me in with stop just below (This was also a bull div on the hour chart)
2) Not much of a hook testing the div.
3) Crossed the expected EMA to form C. Now we have the ABCD and can project the target to D
4) Bulls found support, so now we feel more confident.
5) Paused for a while at the 50% level allowing the EMA to catch up with the price.
6) EMA made the average swing high and the price hit the target D
I have put a box around the section of chart for reference and other things I like to note are the time it takes and what was going on with the RSI.
I'm in the US so I try and trade the 16:00 so I usually begin looking at charts around 15:00. Would this be a more acceptable plan of action given my start time.
I take inference from the 1HR bear div, zoom into the 5M and take the bear RSI div that broke the 1HR ZOO level at 1.3131. It fails to return price back to 1HR 26 ema so we now expect price move to the next ZOO at 1.3153. We ignore all bear div signals because of this and only look to take them if presented at 1.3153. Now do I take the first bear RSI div in the 5M chart at ZOO 1.3153, or do I wait for the 16:00 hour candle to close as a bear div to use as inference and then take the hidden div in the 5M chart? Either way, we are now short, we exit the short and go long at the bull div huskyboy outlined. Now why do we ignore the first two bull divs? I'm not competent in trading ABCD's yet so maybe that is the reason. Is this a more reasonable plan of action?
Given I start at 15:00, I ignored the bull div in the 5M chart at the 1HR ZOO 1.3120. Should I have taken that into account in any way, is that why you chose to not take the bear RSI div at 1.3131 huskyboy?
Also, huskyboy, why is 1.3102 a 1HR ZOO? Thanks for taking the time everybody. Appreciate the help.
{quote} There is an ABCD to 3005 though on the hour...Not worth trading that small distance. The five min has already hit its ABCD so no joy there either.
Ignored
yep didn't see that
ABCD on M30 and price is now struggling at its 50% level; price took off that 50% level in a bull div