Joined Nov 2019
|
Status: Failure Make Success
|460 Posts
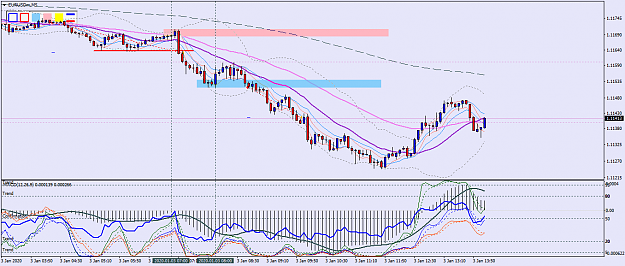
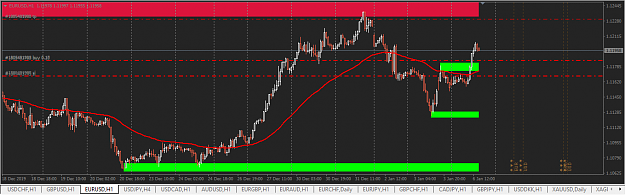
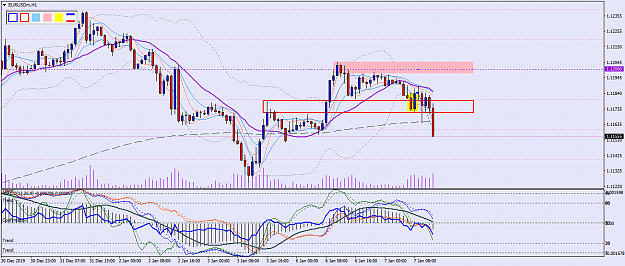
A rejection candle from previous 1 hour with supply already taken. Im waiting the confirmation for buy on UsdCad. Depends on how the current candle will close.
A rejection candle from previous 1 hour with supply already taken. Im waiting the confirmation for buy on UsdCad. Depends on how the current candle will close. {image}
Ignored
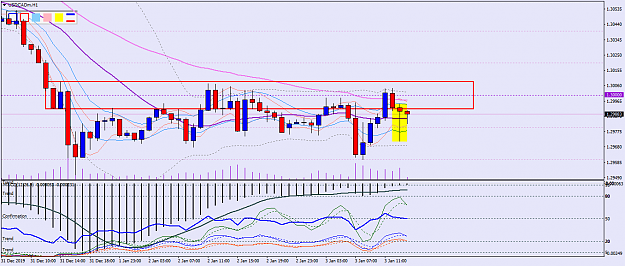
Eastrader - USDCAD
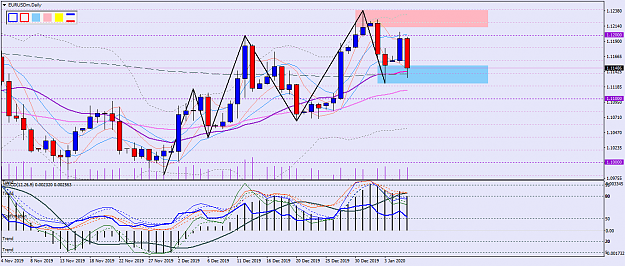
There is a Vacuum zone at 1.3005 which is the reason why price is in consolidation in this area. Imagine a hole in the chart that sucks in liquidity creating a tight range either above or below zone. It creates a herd validation box where it will be getting liquidity by encouraging traders to go short. I am looking for a clean break from this area. Go now to the core of market at M1 Chart and see the magic occurring here. The key break out will be a long H4 candle moving away. I favour a long and breakout out of the box.
Cheers Rick
Trading thin liquidity at the boundary of the charts
{quote} Eastrader - USDCAD There is a Vacuum zone at 1.3005 which is the reason why price is in consolidation in this area. Imagine a hole in the chart that sucks in liquidity creating a tight range either above or below zone. It creates a herd validation box where it will be getting liquidity by encouraging traders to go short. I am looking for a clean break from this area. Go now to the core of market at M1 Chart and see the magic occurring here. The key break out will be a long H4 candle moving away. I favour a long and breakout out of the box....
Ignored
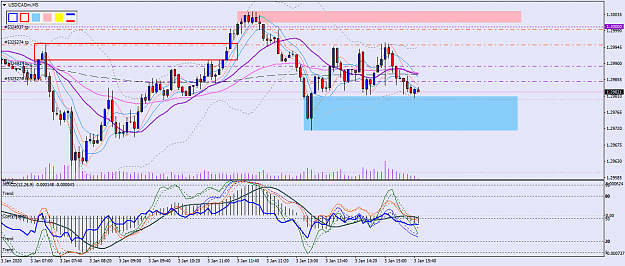
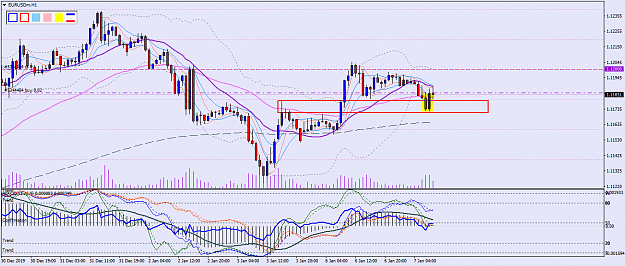
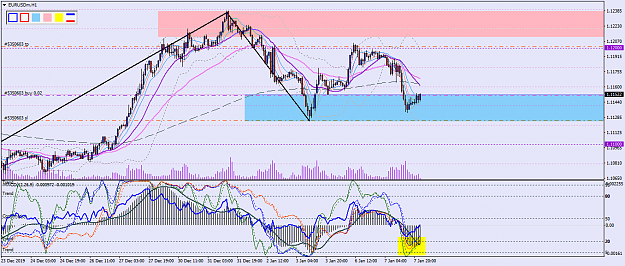
It's new to me. How can i detect that vacuum zone? It means where the big boys creating orders?
Taken ur advice, finding nice demand on M5 (can't see clear demand on M1) 2 long post with 10p target each.
{quote} It's new to me. How can i detect that vacuum zone? It means where the big boys creating orders? Taken ur advice, finding nice demand on M5 (can't see clear demand on M1) 2 long post with 10p target each. {image}
Ignored
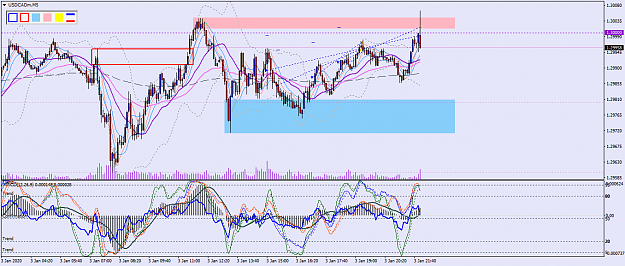
Actually 4 buy entries made with 10p target each. Closed with 40 pips at the end when price reached supply level.
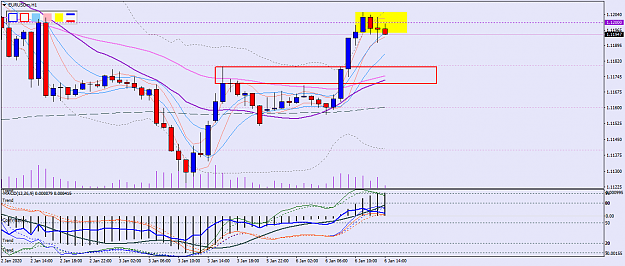
Give a try on this custom sup and demand indicator, was made some changes ... works very good for me. as you can see there is a lot of settings for choose ... Not my indi. From a friend of mine but no problem in share, glad... {image} {image} {image} {image} {file}
Ignored
Dcrs, can you share your template with this indi? Thanks!
{quote} It should be up then, it's already break supply i tought thank you Adam
Ignored
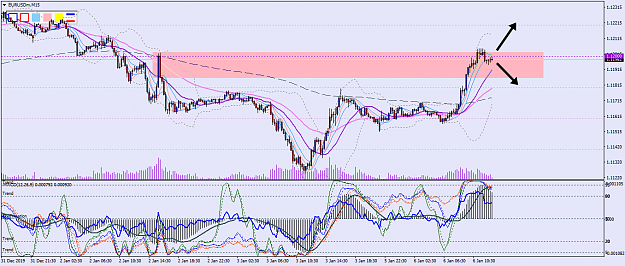
In general, I have great trading results, but I can’t recommend trusting someone only with words. Therefore, keep this picture in mind and see who was right this time. ))))
{quote} In general, I have great trading results, but I can’t recommend trusting someone only with words. Therefore, keep this picture in mind and see who was right this time. ))))
Ignored
wow..thats cool, the price i think will break up, we'll see if this 1 hr candle can do it