Disliked{quote} @Robot Trader -- I know you already know what I am about to write below. I decided to summarize where things currently stand for the benefit of those just arriving here from @bluesteeles new thread. {quote} You can't "filter-out" repainting -- that's the property of an indicator. A trading system needs (at least) 3 components -- a signal generator, a filter, and an Exit strategy. For signal generation I'm using an extreme price that pokes its head above or below a band. When a price pokes its head above or below a band we call that a candidate...Ignored
There is 3 Types of Trend = Price Action Behaviour
Uptrend
Downtrend
Flat, Neutral, Sideways
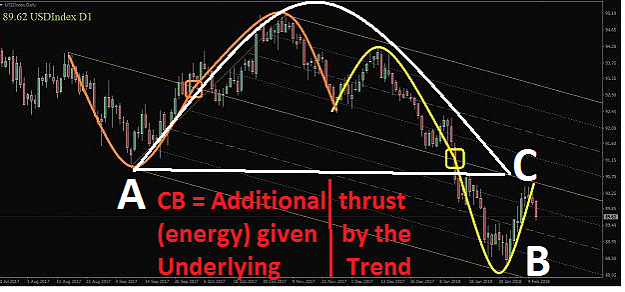
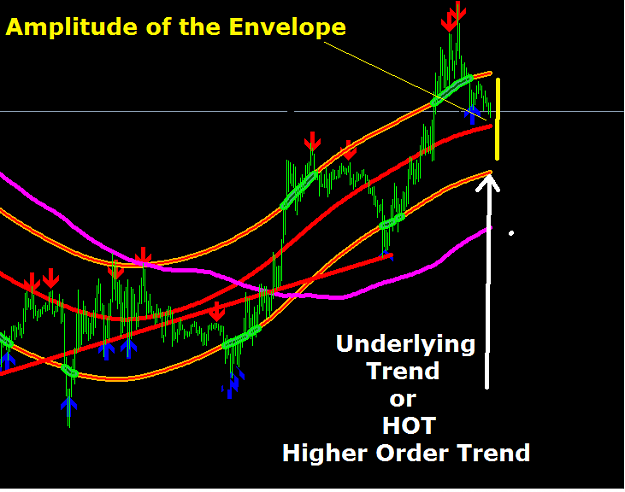
Price Action is the composite of 2 Components
the Amplitude of the Envelope you observe or use + the Underlying trend
the Underlying Trend is the Composite result of the sum of all Cycles (Force) of Higher Order ( greater TimeFrames Price Action)
hence
a) in Sideways Price Action the Strength and influence of the Underlying Trend is weak, tending towards zero.
Price Action Swings are very close of the Amplitude of the Envelope you observe or use.
Cycles are easily observable just by looking at the chart.
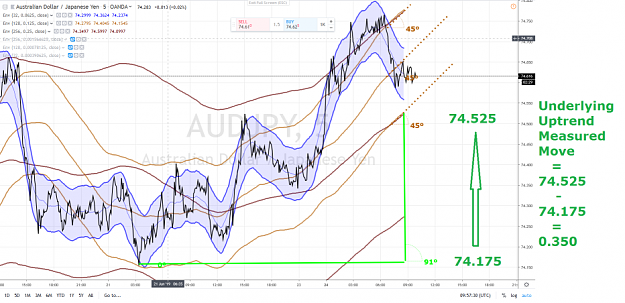
b) if Price Action is Uptrending, it means that the underlying Trend strength ADD more fuel to the Amplitude of the Uptrending Envelope you observe or use. Hence probabilities are high that your target will be overshoot - will go higher than normally forecasted
in a counter downtrending rally your Target will be undershoot Price Action will not go as low as normally forecasted
b) if Price Action is Downtrending, it means that the underlying Trend ADD more fuel to the Amplitude of the Downtrending Envelope you observe or use.
Hence probabilities are high that your target will be overshoot on the downside - will go lower than normally forecasted
in a counter uptrending rally your Target will be undershoot Price Action will not go as high as normally forecasted
Attached Image(s) (click to enlarge)
2