Hi Nih98
When I first saw your posts on the other thread I got the impression that you thought you RSI were mimicking the Fractal wick indicator thing, meaning that it as caused so much disruption and confusion on that thread, I am a little apprehensive to use it, as I think that the RSI do the job just as well. Do you really think that they add value and are a must have necessity on the set up
Thanks Dave
Hi Nih98 When I first saw your posts on the other thread I got the impression that you thought you RSI were mimicking the Fractal wick indicator thing, meaning that it as caused so much disruption and confusion on that thread, I am a little apprehensive to use it, as I think that the RSI do the job just as well. Do you really think that they add value and are a must have necessity on the set up Thanks Dave
Ignored
Hi Bro, we need main chart tools to help us 'see' better or if we still don't understand how to use them then it will only 'confusing' us and cluttered the charts. The Multi Dimension Fractal lines from Master SwingMan give us 'quick visual info' about our current playable boundaries. That's why in one of my post, I said that the most important is the last 2 'closest' lines above and bellow current price. While the rest of the lines, (because I set the template End of line to candle body) inform 'visually' about 'orders/stops' density.
In the other hand, Oscillator sub window, as its name stated, will work by oscillating the incoming values to inform us 'visually' about 'where are you now' compare/in relative distance to 'equilibrium' or the balance area or in more traditional term is 'common/fair price'.
So, we need both tools, the main chart tools and the sub windows / oscillator tools.
Hi Nih98 When I first saw your posts on the other thread I got the impression that you thought you RSI were mimicking the Fractal wick indicator thing, meaning that it as caused so much disruption and confusion on that thread, I am a little apprehensive to use it, as I think that the RSI do the job just as well. Do you really think that they add value and are a must have necessity on the set up Thanks Dave
Ignored
One gives the actual price level, the other gives the momentum read. We need both information. Trading opportunities appear when there occur "error in optimism or pessimism" causing over/under valuation conditions.
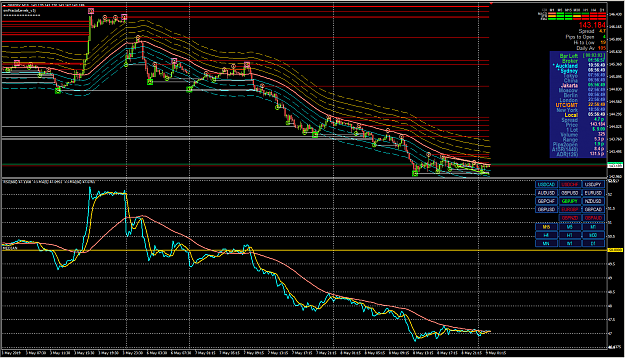
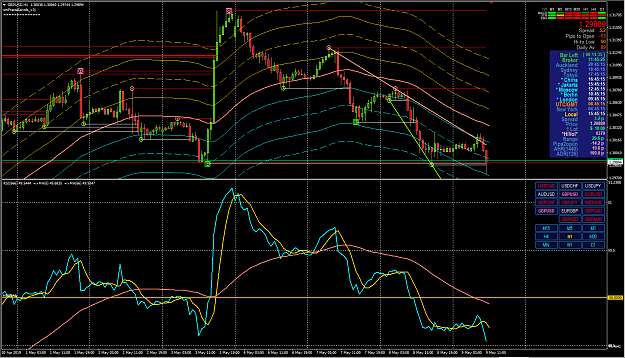
GBP/JPY M15 {image} Look at the last couple hours price action dance in the main chart. Look at 'where are we now' in RSI sub windows in relation with Median (level 50). Look at TMA band mid line (LWMA 66) in main chart and LWMA 66 RSI Watch for 'side shifting' NIH
Ignored
Oh, Divergence and sometimes RSI may leads to show us where price what to go
Thank you Brother
Best regards J
Also want say to all this new thread followers and newcomers. I meet our Brother NIH98 some couple of years ago, this was a long journey for me, but now I think I get it so close. On one forum, one wise man had a sign: “Some are faster, some are slower, some are will never get it”, I was in a second group, who got it very slow but I won’t stop to learning and always try to open my mind, like first time, like newbie so please read carefully, try to understand what our Brother NIH98 wants say to us.
Best regards J
Also want say to all this new thread followers and newcomers. I meet our Brother NIH98 some couple of years ago, this was a long journey for me, but now I think I get it so close. On one forum, one wise man had a sign: “Some are faster, some are slower, some are will never get it”, I was in a second group, who got it very slow but I won’t stop to learning and always try to open my mind, like first time, like newbie so please read carefully, try to understand what our Brother NIH98 wants say to us. Best regards J
Ignored
I am also in the 2nd group. Slow but not giving up.
{quote} One gives the actual price level, the other gives the momentum read. We need both information. Trading opportunities appear when there occur "error in optimism or pessimism" causing over/under valuation conditions.
{quote} Hi Bro, we need main chart tools to help us 'see' better or if we still don't understand how to use them then it will only 'confusing' us and cluttered the charts. The Multi Dimension Fractal lines from Master SwingMan give us 'quick visual info' about our current playable boundaries. That's why in one of my post, I said that the most important is the last 2 'closest' lines above and bellow current price. While the rest of the lines, (because I set the template End of line to candle body) inform 'visually' about 'orders/stops' density. In...
Nih98 Under RSI 50 Rejection of Channel centre line Look to sell, Outer channel tagged {image}
Ignored
Hi Bro, to check 'where we are' since MT4 hv 9 TFs , we consider the first 4 as long term analysis (Monthly, Weekly, Daily , H4). and the 2nd 4 as short term / intraday analysis ( M30, M15, M5, M1) while H1 is the 'bridging' TF since she's in the middle.
So, Maybe we could check GBP/JPY on H1, while also look at 'her' Parent GBP/USD x USD/JPY.
GBP/JPY H1
Attached Image (click to enlarge)
GBP/USD H1
Attached Image (click to enlarge)
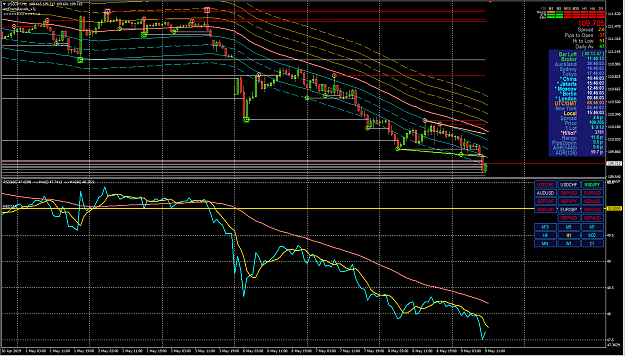
USD/JPY H1
Attached Image (click to enlarge)
From all the 3 pairs that related each others in correlation, we could see that they already little bit too far from 'equilibrium' / median.
and also this is already Thursday.
and if you see USD/JPY currently 'met' so many dense lines. so, it seem that GBP/USD will hold, while GBP/JPY and USD/JPY will try to back to the 'equilibrium' / median and reach their above targets.
{quote} Hi Bro, to check 'where we are' since MT4 hv 9 TFs , we consider the first 4 as long term analysis (Monthly, Weekly, Daily , H4). and the 2nd 4 as short term / intraday analysis ( M30, M15, M5, M1) while H1 is the 'bridging' TF since she's in the middle. So, Maybe we could check GBP/JPY on H1, while also look at 'her' Parent GBP/USD x USD/JPY. GBP/JPY H1 {image} GBP/USD H1 {image} USD/JPY H1 {image} From all the 3 pairs that related each others in correlation, we could see that they already little bit too far from 'equilibrium' / median....
Ignored
Nih98
Brilliant post, that is why I was hoping and so pleased you have agreed to share your vast knowledge with us.
Thank you so much
Dave
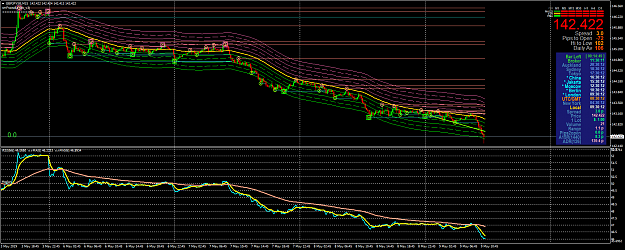
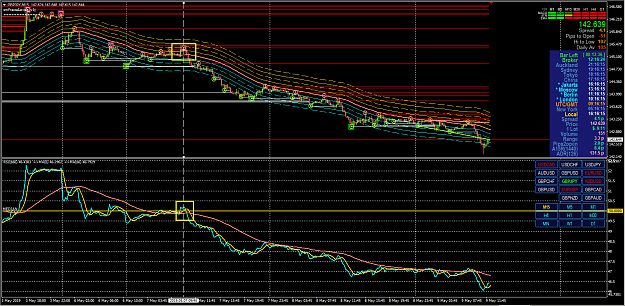
Now. let see GBP/JPY from the H4 level point of view ( Smallest Long term TF, for represent weekly range (30 bars H4)), then the 'bridge' H1 level point of view, and the M15 (for short term TF as working TF).
this 3 screen levels H4 - H1 - M15 with 1:4 ratio, mostly work great to analyze what's going on for Intraday traders .
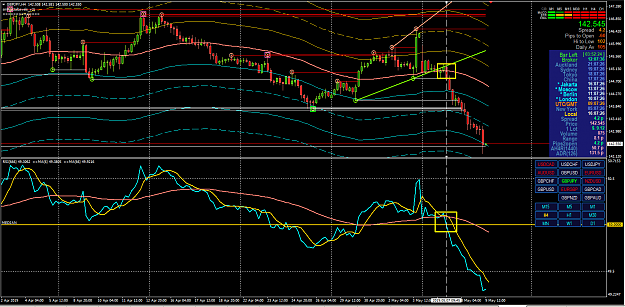
GBP/JPY H4
Attached Image (click to enlarge)
We could see (Yellow rectangles on main chart and RSI sub window), when price and RSI line cross 'down' equilibrium/median so we go south and we marked with white vertical line,
then we move down to H1 level.
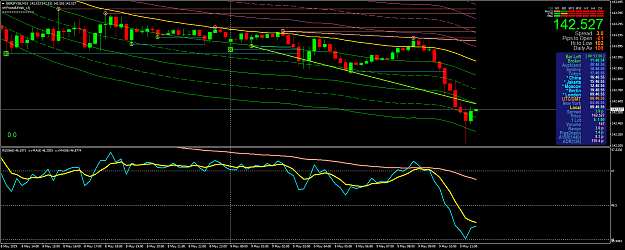
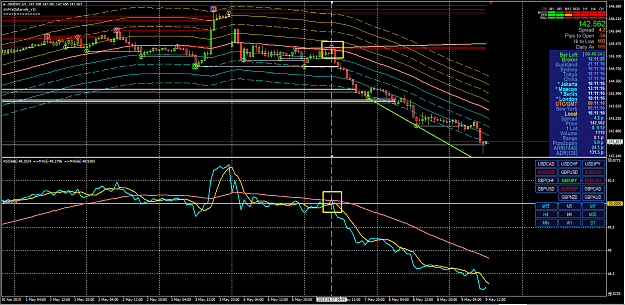
GBP/JPY H1
Attached Image (click to enlarge)
same white vertical line, but little bit more detail on how 'price action' react in both Yellow rectangles in main chart and sub window, and we 'see' upper fractal lines to 'support' our 'away from fractal/target' decision and go to south.
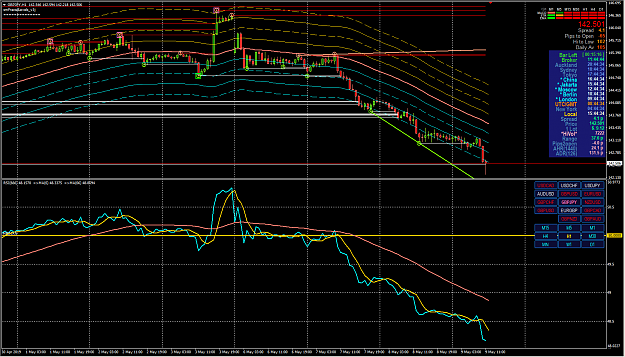
and let see the smallest TF level on M15 as our working TF.
Attached Image (click to enlarge)
still on same white vertical line, and more detail to make sure we will go 'south'
So, in this scenario, if starting from that white vertical line, our bias is 'go south' and then if in every close of M15 bullish candles after that white vertical line, we open small short positions and keep scaling in as long as our RSI line stay healthy bellow our LWMA 66 (salmon color) then what we get in our equity right now ?