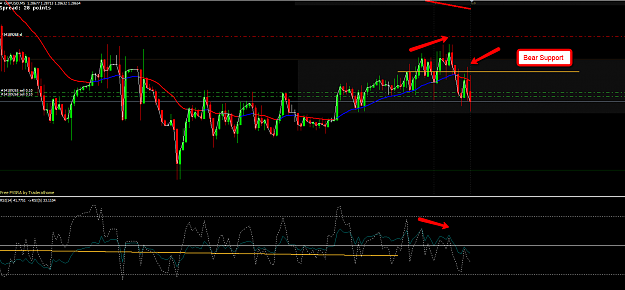
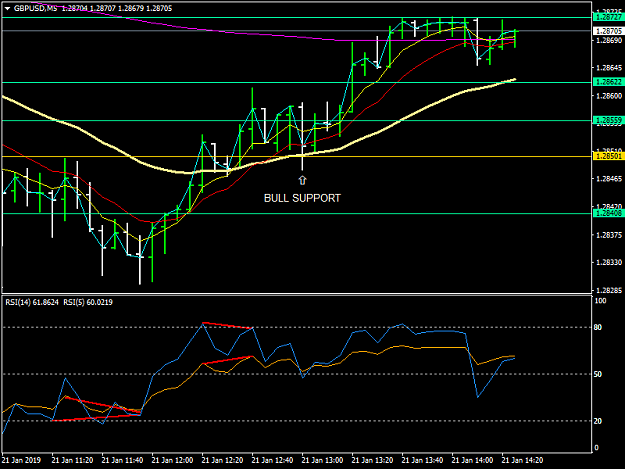
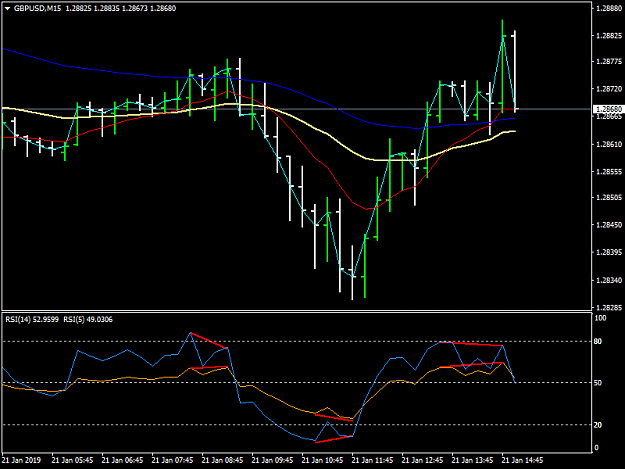
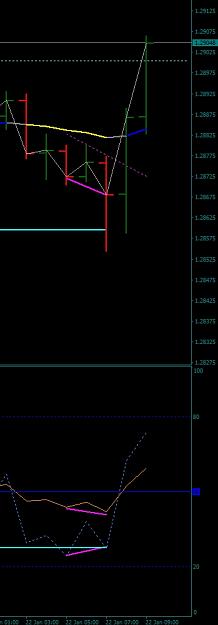
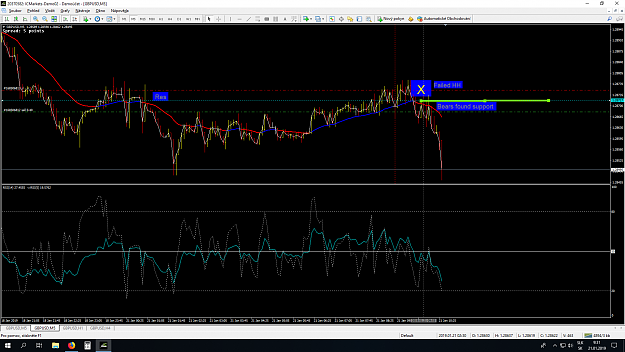
Just to add 5 min chart with my analysis.
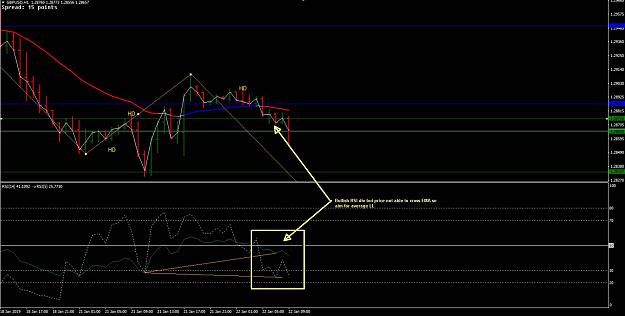
EDIT: EMA did not break "Res"(resistance) at point "X" first sign of weakness on bull side. After that bears found support (yellow line), Fast RSI below Slow RSI, fine signal to go short (gray vertical line 09:55)
masofras
Attached Image (click to enlarge)
2