Thank you kindly
I understand it was very silly to ask but it just give more visual
If I may ask you please, based on Candle stick patterns please some one explain this system please
If it distracts everyone then please kindly PM me and will be glad to know it
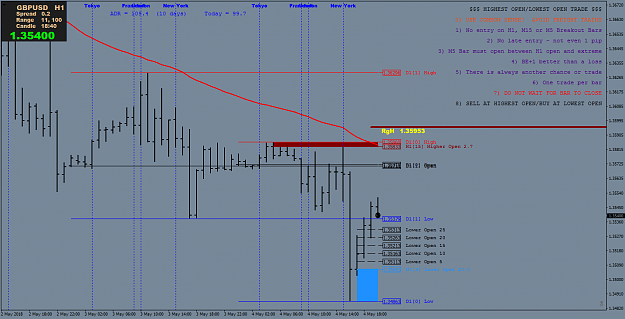
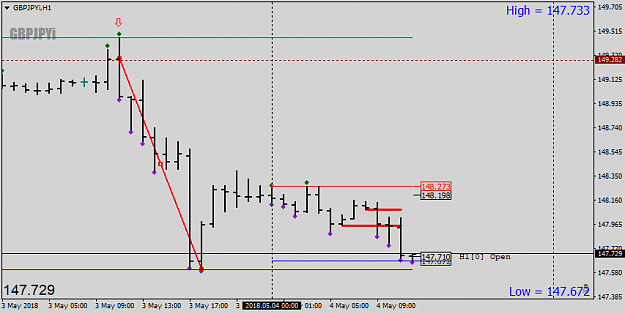
{image} Long EU same bar +5. NFP day so things could get funky later. Still in my EJ and GJ trades from yesterday +102, +132.
Ignored
Nice plays this week, Hal.
I don't mean to sound like your Jiminy Cricket but do remember that Japan will come back online next week and so I would be very, very, wary of giving into the temptation of holding any JPY pairs open over the weekend, if that is in your mind.
{quote} Nice plays this week, Hal. I don't mean to sound like your Jiminy Cricket but do remember that Japan will come back online next week and so I would be very, very, wary of giving into the temptation of holding any JPY pairs open over the weekend, if that is in your mind.
Ignored
I thought that was a cricket. I have them on on 20 trailers Lem, so I am in for the rest of the year if need be. But I think NFP release will take me out at profit long before then. Yeah I nailed a few this this week, persistence pays off. Thanks...
{quote} I thought that was a cricket. I have them on on 20 trailers Lem, so I am in for the rest of the year if need be. But I think NFP release will take me out at profit long before then. Yeah I nailed a few this this week, persistence pays off. Thanks...
Ignored
I was imagining a jump over any trailer if it gaps - but yeah, I know you know what you're doing. The comment was more for anyone else dropping by.
Got it. Here is a real laugher.... I just checked the trades and I had never switched them to 20 trailers yesterday. The original stops were still on. No wonder I am still in them...
Got it. Here is a real laugher.... I just checked the trades and I had never switched them to 20 trailers yesterday. The original stops were still on. No wonder I am still in them...
Got it. Here is a real laugher.... I just checked the trades and I had never switched them to 20 trailers yesterday. The original stops were still on. No wonder I am still in them...
Ignored
i thought that, good "lucky decision"
i do it similar with the second position and mostly let them run till the end of the day. no trailer.
successful trading requires patience&discipline and can be boring.
{quote} i thought that, good "lucky decision" i do it similar with the second position and mostly let them run till the end of the day. no trailer.
Ignored
Attached Image (click to enlarge)
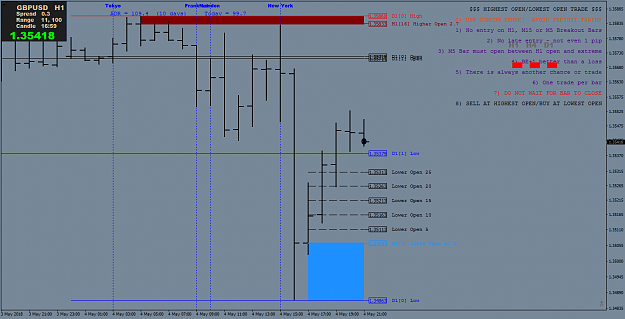
Yep, good idea. I usually like the trailer as I often will be gone after I get them running. You can see here it ran down to about +170 by then end of the before turning.
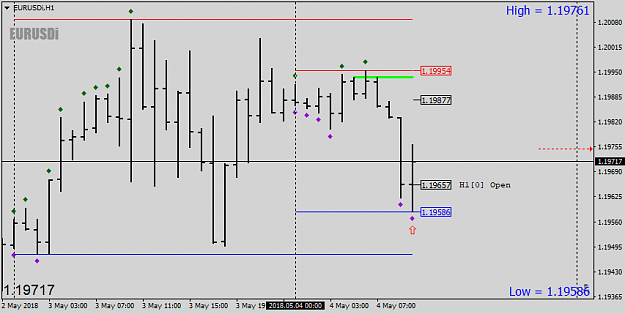
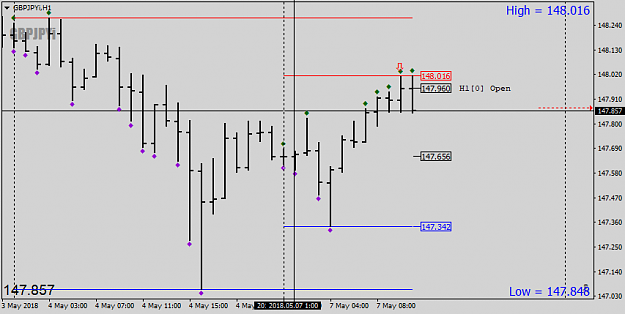
{image} I repeat this so new comers don't have to go back to the first post: A bar makes a NEW DAILY high and closes. Next bar fails to make a higher high and reverses. Sell when price drops below the open price of the current bar. A bar makes a NEW DAILY low and closes. Next bar fails to make a lower low and reverses. Buy when price rises above the open price of the current bar. Let me rephrase in the form of yes/no or true/false questions. 1) Did a new daily high or new daily low happen during the previous bar. If YES/TRUE go to question 2, otherwise...
Ignored
Hi,
I have understood the rules. Same as your other thread.
Let me ask you a question. Usually on a bearish trend, in Asia, before Frankfurt open the hourly bar makes a new high for the day and reverses.
For example I am seeing GU pair which is bearish for many days.
Do you suggest to look for hourly bar to make a new high for the day and next bar failure.? I mean one should look to sell condition ?
If that is the case, do You suggest anything see trend?
The rules of the system suggests both sides of trades.
Thank you kindly I understand it was very silly to ask but it just give more visual If I may ask you please, based on Candle stick patterns please some one explain this system please If it distracts everyone then please kindly PM me and will be glad to know it Thanks in advance R
Ignored
You don't need to know candle ''patterns''. This method is broken down into three questions:
1: Did this H1 candle make a new High?
If the answer is ''yes'', then...
2: Did the H1 candle that follows that new High, candle #2, test and fail to make a higher High?
If the answer is ''yes'', then...
3: Enter a SELL trade as price drops back and crosses the Open Level of Candle #2.
That's it. Do the opposite for BUY trades.
If the answer to Q2 is ''No'' and the candle #2 did make a newer High, then go back to Q1.
{quote} You don't need to know candle ''patterns''. This method is broken down into three questions: 1: Did this H1 candle make a new High? If the answer is ''yes'', then... 2: Did the H1 candle that follows that new High, candle #2, test and fail to make a higher High? If the answer is ''yes'', then... 3: Enter a SELL trade as price drops back and crosses the Open Level of Candle #2. That's it. Do the opposite for BUY trades. If the answer to Q2 is ''No'' and the candle #2 did make a newer High, then go back to Q1.
Ignored
It is clear, yes, but is it always good to trade in the trend direction?
Trend : If today's hourly candle high is not broken the yesterday's high, then is bearish trend, can we call it?
{quote} Hi, I have understood the rules. Same as your other thread. Let me ask you a question. Usually on a bearish trend, in Asia, before Frankfurt open the hourly bar makes a new high for the day and reverses. For example I am seeing GU pair which is bearish for many days. Do you suggest to look for hourly bar to make a new high for the day and next bar failure.? I mean one should look to sell condition ? If that is the case, do You suggest anything see trend? The rules of the system suggests both sides of trades. I have 200 EMA as trend setter...
Ignored
In general, trade what you see. Try not to over-analyse things.
I understand your question and if the best way to deal with this kind of thing is to watch and understand how a particular pair behaves over a period of time. In this case, is that hourly bar before the Frankie open reversing, a repeatable event you can take advantage of? Does it fit into 1-2-3. If so, that's fine, make it part of your trading plan. If not, then ignore it.
The more you filter the number of pairs you watch and run a stable of charts that you like, the more you will see their movements as repeatable patterns to fit into how 1-2-3 works (or not).
I'd also say that using the 200 ema to filter trades is going to keep you out of a lot of good moves.
The beauty of 1-2-3 is in its simplicity - don't overthink it.
{quote} It is clear, yes, but is it always good to trade in the trend direction? Trend : If today's hourly candle high is not broken the yesterday's high, then is bearish trend, can we call it?
Ignored
I don't pay much, if any, attention to the previous day's High or Low.
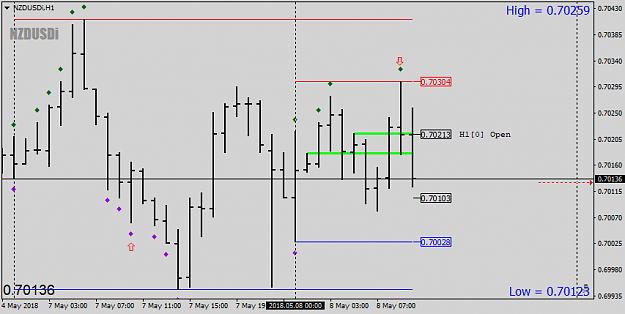
Short GJ +5 locked. GU is on holiday today, but enough movement here to capture a few pips. I liked the move right to the high and then failing coming back down.