1.224 is the bottom of the Higher time frame range unless it can shoot through i don't see it going past by much before going back up. great buy about to come
Ignored
Still holding your "great buy"?
When you're not sure Short or Long - toss a coin! Chances are 50% !!!
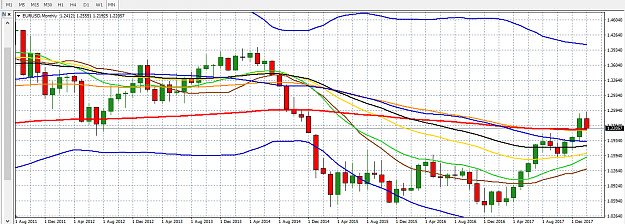
{quote} Easy there ,,,lol,can you tell me what today is ,,,,,,,,,,,,,,,maybe last day of month ,,,,,,,gonna have to find a place to sell to get it towards 1.20 ,,,,its probably not current levels ,,,,,,,might I suggest seeing what happens around a rough Monthly price average ,say like 1.2345 ish atm,,,current price is exactly the mid between 2 ext tgts on monthly ,,,just saying {image}
Ignored
Some 10 days ago it was clear EU goes to 1.22 first then 1.20 (possibly). I made an appropriate call. I remember you made it too. Seems that people are concentrated on "price action" on 5-30 min charts and forget to look at Daily, Weekly and Monthly charts' price action.
When you're not sure Short or Long - toss a coin! Chances are 50% !!!
obviously :/ not when i had a SL, but that being said, did not lose any of my personal money and still think it would be better to find a long were we are at now just jumped the gun a little to soon. sue me . will recoup it soon anyway.
powell talks again tomorrow so ill wait till afterwards seeing as everyone loves frilly words, though would be lmao if he is bearish this time or if by some tragic fate the 20% ish chance a rate hike dose not happen next month where shall we go the.
{quote} Some 10 days ago it was clear EU goes to 1.22 first then 1.20 (possibly). I made an appropriate call. I remember you made it too. Seems that people are concentrated on "price action" on 5-30 min charts and forget to look at Daily, Weekly and Monthly charts' price action.
Ignored
monthly was def looking 1.26 or higher depending on how you want to draw the trend lines for a resistance.
daily was either going to catch an uptrend line at 1.23 or side ways 1.22, for support.
weekly is the only one i would say suggesting 1.2
monthly can still get there, daily is at a critical point, weekly is deepening on what happens next on daily. so whats next up or down, 2 are up one is down at the current point.
{quote} monthly was def looking 1.26 or higher depending on how you want to draw the trend lines for a resistance. daily was either going to catch an uptrend line at 1.23 or side ways 1.22, for support. weekly is the only one i would say suggesting 1.2 monthly can still get there, daily is at a critical point, weekly is deepening on what happens next on daily. so whats next up or down, 2 are up one is down at the current point.
Ignored
Thanks for your answer. Don't take my questions as personal attack, it is just interesting for me a decision making process of other people
Back to EU trading. If you look at Monthly Ichimoku clouds , it suggests that we are at the upper bound of selling cloud. Stochastic suggests overbought condition for a significantly long period of time. Also, Monthly 200 SMA was broken upside last month. Usually the first test of 200 SMA suggests it is unsustainable and we should go back below or at it and try to breakout again. Weekly charts only confirms this theory. So, I disagree on your outlook of Monthly chart.
When you're not sure Short or Long - toss a coin! Chances are 50% !!!
{quote} Thanks for your answer. Don't take my questions as personal attack, it is just interesting for me a decision making process of other people Back to EU trading. If you look at Monthly Ichimoku clouds , it suggests that we are at the upper bound of selling cloud. Also, Monthly 200 SMA was broken last month. Usually the first test of 200 SMA suggests it is unsustainable and we should go back below or at it and try to breakout again. Weekly charts only confirms this theory. So,...
Ignored
didnt see it as an attack just saying you could see it like this.
200 sma on my chart for monthly has not been touched yet mines at 1.275 right now, weekly touched its back in late 2017 and is not near touching it again right now and gave an up move on that last touch, daily has not touch its again yet last was in 2017. just looking for insight. i don't use the cloud thing. just trend lines, sma/ema, res/sup areas and price action.
and monthly is now touching one of my lines so that with the support we are at it can go back up
{quote} didnt see it as an attack just saying you could see it like this. 200 sma on my chart for monthly has not been touched yet mines at 1.275 right now, weekly touched its back in late 2017 and is not near touching it again right now and gave an up move on that last touch, daily has not touch its again yet last was in 2017. just looking for insight. i don't use the cloud thing. just trend lines, sma/ema, res/sup areas and price action. and monthly is now touching one of my lines so that with the support we are at it can go back up
Ignored
Sorry, I use 200 EMA, not SMA. (Red line one on my chart). But even on SMA it just touched 200 period line (acts as resistance).
Attached Image (click to enlarge)
When you're not sure Short or Long - toss a coin! Chances are 50% !!!
Joined Jul 2017
|
Status: Active member
|1,655 Posts
Anyone looking at buying around this area?
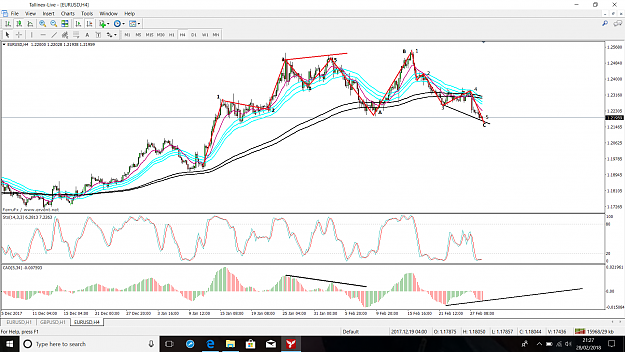
Something I'm looking at Price usually diverges on MACD or CAP (both the same pretty much) on waves 3-5 from wave 5 we should see a ABC correction pattern, looking on the 4 hour we have the divergence as displayed and ive attempted to count the waves based on divergence so if ive got my counting correct on the small 1-5 we should now be seeing a ABC correction of this down move, looking at the bigger picture we are now at the end of point C correction which of course would point to upmove.
Daily stochs are in oversold along with 4 hour
Anyone looking at buying around this area? Something I'm looking at Price usually diverges on MACD or CAP (both the same pretty much) on waves 3-5 from wave 5 we should see a ABC correction pattern, looking on the 4 hour we have the divergence as displayed and ive attempted to count the waves based on divergence so if ive got my counting correct on the small 1-5 we should now be seeing a ABC correction of this down move, looking at the bigger picture we are now at the end of point C correction which of course would point to upmove. Daily stochs...
Ignored
Looking around 121.80.... I'd be looking at current price, but my spidey sense tells me there will be a stop sweep before it moves up...
Perhaps I can help...check back about three pages. I posted a chart that shows the final rising trend line on the 60mins TF...if it going to bounce its going to be soon once buyers take a punt off that trend line.
|
Joined Oct 2016
|
Status: I UN-QUIT Trading again...
|407 Posts
Longs have it harder here in short term, because of the 4hr spike down and channel down, I call that MT or medium term.
Longer term still looks up, for me that's daily and that's about as far as I go zooming out.
Conflict between them happens and is ok, however, at this point LT is right at support and MT/ST has come down to it.
I've traded long and it's been hard. I missed shorting because of various reasons I'm working on, but the scalps and some swings have been better looking on the short side. This is a tricky point because of the lack of room for ST to meet LT, it's late in this MT trend leg as it is at LT support area 2110 or so.
I expect tests up & down, failed breaks lower, tests higher, maybe a range, or if there is big news, a measured move equal to the beginning of the spike that came down from 2340 to 2250 and channel 2250 to 2200 which is 150 or so, I don't see it happening easily since I"m a pessimist.
big money makes big moves and then hides during small money chasing.
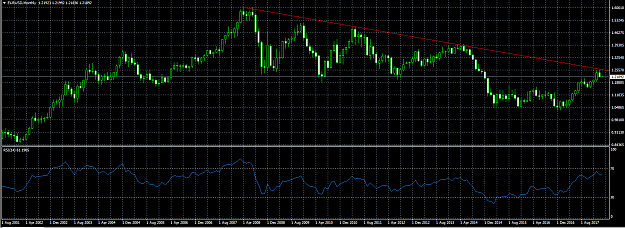
Bigger picture. We are still in down trend. RSI never could pass 70 after 2008 mortgage crisis. And prices after touching the resistance again started to go down. Due to persistent low inflation and problems in Euro bonds and banking system I don't think that resistance will be broken until next crisis. When next crisis comes I don't have any idea which currency will shine. But less hope that there won't be any economic crisis near soon.