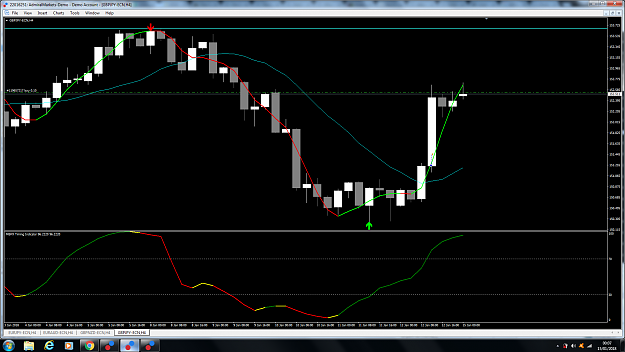
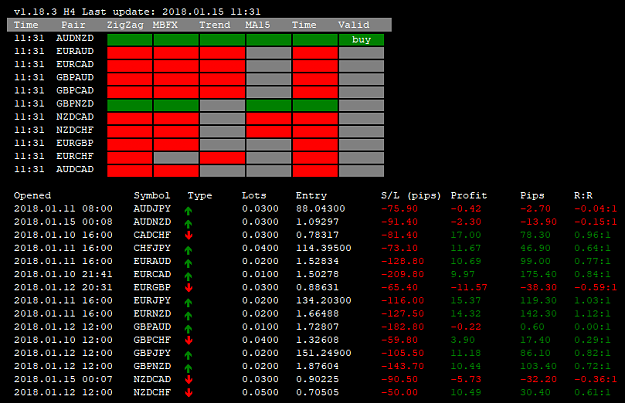
I've been doing some chart analysis over the weekend. I've noticed something a couple things I wanted to ask ebeckers or if anyone else has the answer.
I've highlighted the supposed correct factors in green, and potentially wrong factors in red, correlating with the numbers on the chart.
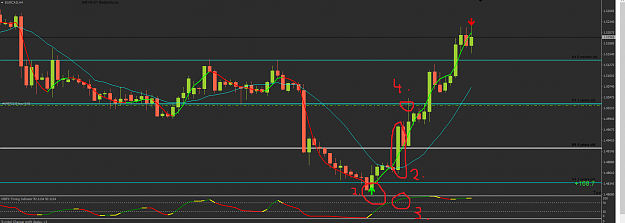
1. ZIGZAG Arrow BUY
2. Candle crosses above MA15
3. MBFX is above 70% (it should be BELOW the 30% according to original rules).
4. Entry for BUY is taken relatively LATE.
So two issues I can see.
1/MBFX is above 70% (it should be BELOW the 30% according to original rules).
and
2/ Entry for BUY is taken relatively LATE.
Another point is, the OPPOSITE ZigZag arrow has appeared. Maybe it would be possible to close the trade should the opposite signal appear?
Any idea why this has occurred? This appears to be the second time I've noticed this.
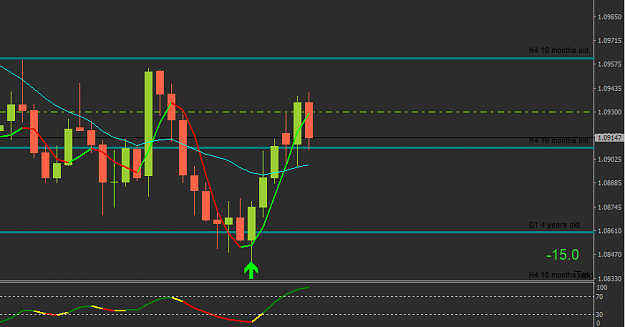
I've highlighted the supposed correct factors in green, and potentially wrong factors in red, correlating with the numbers on the chart.
1. ZIGZAG Arrow BUY
2. Candle crosses above MA15
3. MBFX is above 70% (it should be BELOW the 30% according to original rules).
4. Entry for BUY is taken relatively LATE.
So two issues I can see.
1/MBFX is above 70% (it should be BELOW the 30% according to original rules).
and
2/ Entry for BUY is taken relatively LATE.
Another point is, the OPPOSITE ZigZag arrow has appeared. Maybe it would be possible to close the trade should the opposite signal appear?
Any idea why this has occurred? This appears to be the second time I've noticed this.
Attached Image (click to enlarge)