Evolution of trading over the years. Why support/resistance/trendlines/moving averages important. They are just confirmatory signals, and its up to the trader to make decisions.
{quote} i still dont get it, but thanks nonetheless.
Ignored
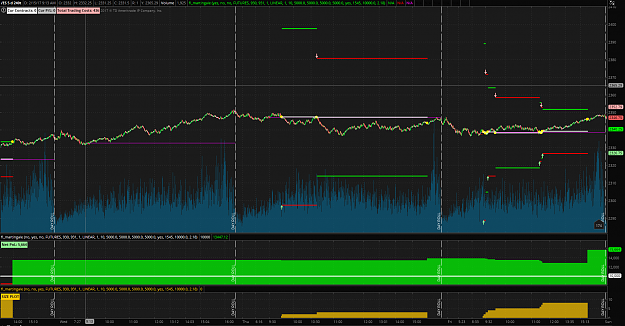
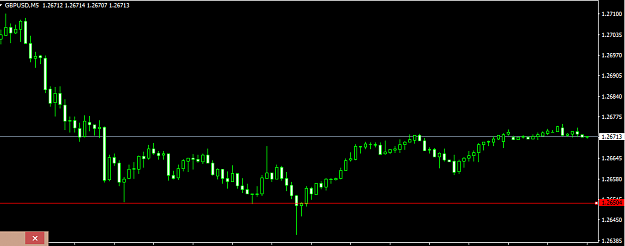
its just a breakout strategy, but instead of it being a interval in price. Its just a single value. The breakout strategy is timed with other indicators, some based on market experience. Very simple and not complex. In above example.. Trump speech triggered volatility.
Price has Brownian motion (noise) and behaves as if it has 'physical' state, like 'mass' inertia' and almost observes 'Newtonian Mechanics'. All the indicators and levels, and MA's are just reference points in terms of how price behaves in accordance with them. Like price bouncing of support/resistance/ or adhering to trend lines. It has those characteristics since, its mostly a linear vector dispersed around a regression.
The main point is does price respect those derivatives of price. If price has no respect for them than those indicators are useless, you need to look for what price respects. And than create a strategy around those variables. Than its just money management after that.
From millisecond to 5 seconds, or any time interval, the actual prices within the interval might as well not exist. Variable A at time (0) and Variable B at time (1).. quantifying how much higher or lower in relation to each other creates magnitude of increase or decrease and creates a scale of measure of price itself.
'price' is quantitized.. meaning 2360 of 'something' ..obviously 2361 of something is only marginally different. But 2400 of 'something' implies magnitude. So from time (0) to time (1), do the ticks within the time interval matter?.. or do they provide any information value to predict tendencies. The deviation of those 'ticks' within the interval imply possible deviation or degree of dispersion into the future.
The dispersion/deviation within interval can create a moving average of 'tendencies'. If dispersion/deviation is low, than their is less likely hood of Variable A and B being drastically different. If dispersion/deviation is high, than there is higher likelihood of A and B magnitude of difference being higher.
The magnitude of difference, determines profit potential.
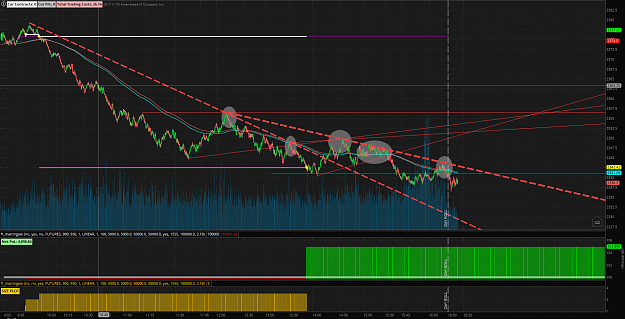
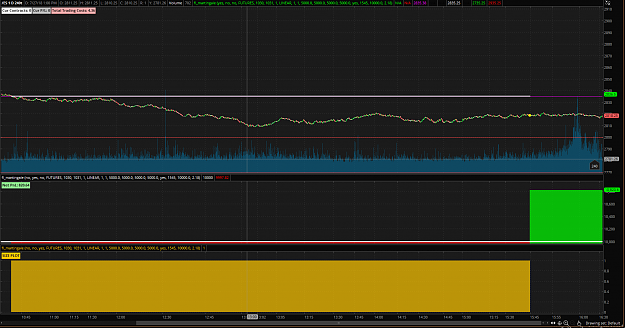
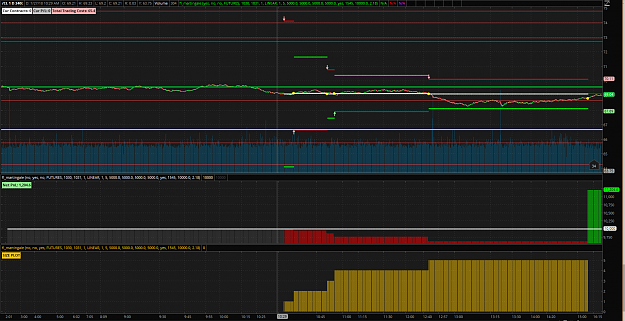
Calculating outliers is a science onto itself. News catalyst makes it so much easier. This technique is the only technique that can use consolidation patterns against themselves. As price consolidates and multiple crosses occur, it triggers escalating unit size till breakout.
Outliers can occur at specific times of the day in a given market, based on historical patterns of orderflow. Also with news events. So specific price within consolidation can become a outlier as a specific time point nears during the day. Even though other metrics wouldn't signify it as a outlier.