- Search Forex Factory
- 24 Results
- mkuefne replied Feb 8, 2021
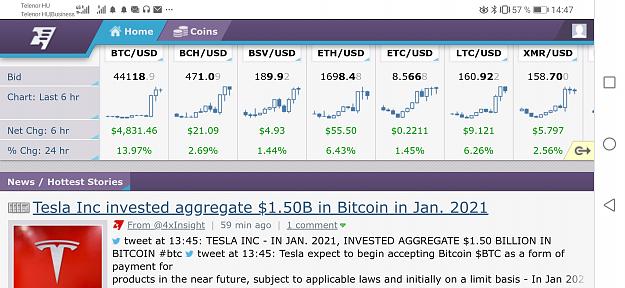
Tesla is now also BTC investor. Apple and Google will probably follow. Michael Saylor is my hero! :-) image
The rise of CRYPTO - Bitcoin, LTC, Ether, Dash, Monero
- mkuefne replied Jan 22, 2021
I think the current drop is due to a new report about Bitcoin double spending (which was NOT true) and Yellens talk about tighter regulation for Crypto market. But whatever was the reason for the recent dip, I know that Grayscale bought BTC for 100 ...
The rise of CRYPTO - Bitcoin, LTC, Ether, Dash, Monero
- mkuefne replied Jan 8, 2021
If the rainbow chart tells us the truth 400.000-500.000 USD is a realistic target around 1 year after the next mining reward halving in 2024. For the current rally the upper red line of the rainbow ends at around 100.000 USD. Sell in this area and ...
The rise of CRYPTO - Bitcoin, LTC, Ether, Dash, Monero

- mkuefne replied Jan 8, 2021
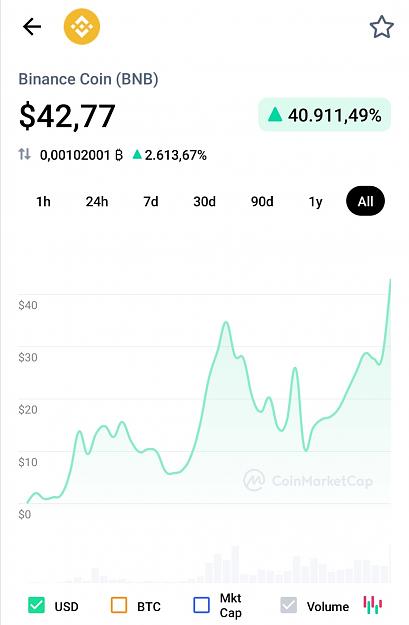
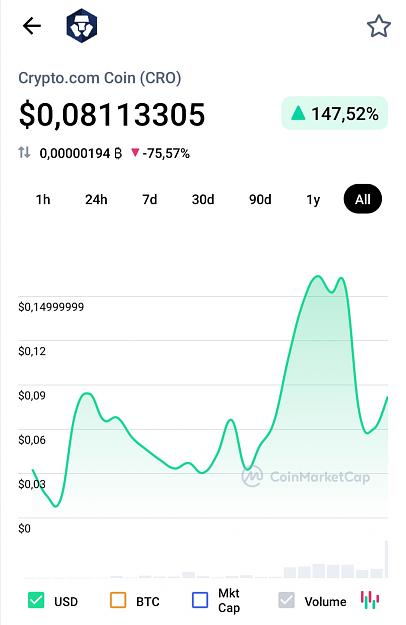
Most Crypto investors talk about BTC and ETH at the moment but I think one specific kind of coins is also worth to have a look at: coins that are launched by an Exchange. In the picture below you can see the development of Binance coin since its ...
The rise of CRYPTO - Bitcoin, LTC, Ether, Dash, Monero
- mkuefne replied Jan 1, 2021
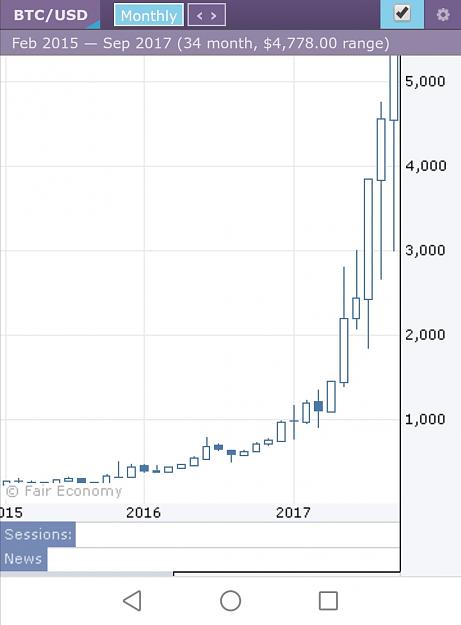
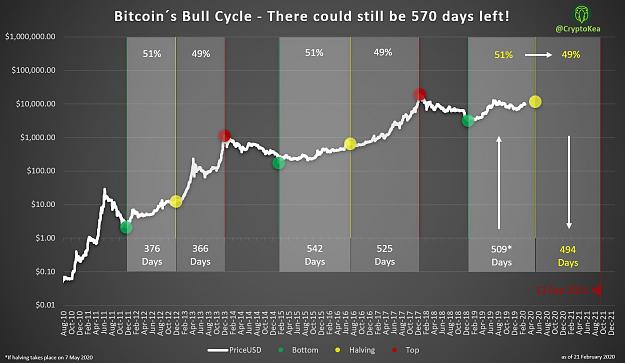
According to this Chart from Feb 2020 bitcoins current bullrun will be over in Sep 2021. image
Bitcoin technical analysis
- mkuefne replied Nov 7, 2018
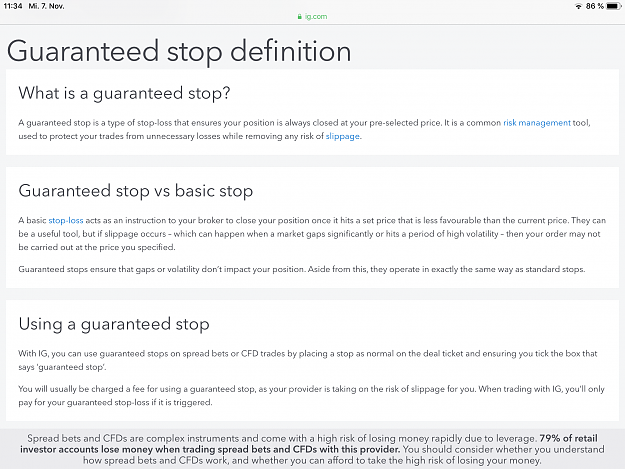
Broker IG Markets offer guaranteed SL for an additional fee. Only on EUR/CHF there is no guaranteed SL available and for trading pairs with the following uncommon currencies there is also no guaranteed SL: BRL - Brazilian real CNH - Chinese renminbi ...
Pro traders who do not use SL, What about Black Swans?
- mkuefne replied May 16, 2018
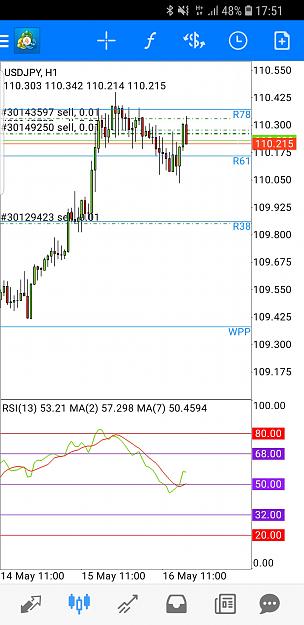
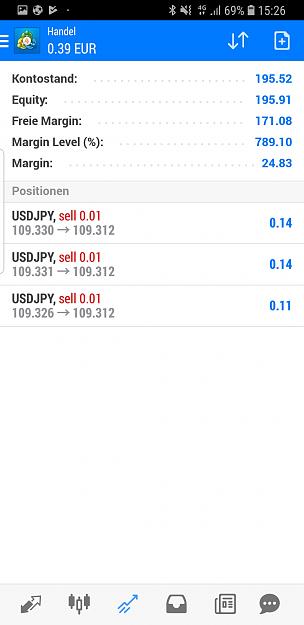
This afternoon's UJ bullrun seems to get out of steam quickly. So I added more shorts.
Pivot Trading
- mkuefne replied May 13, 2018
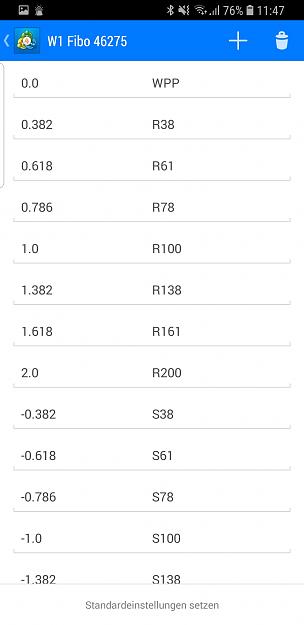
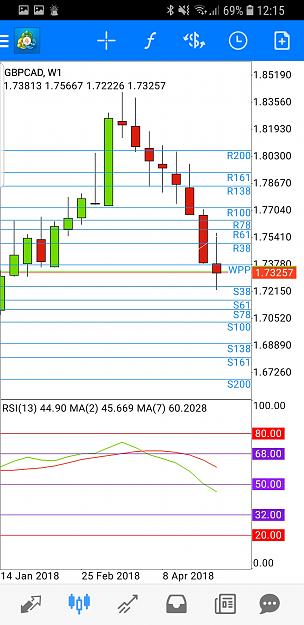
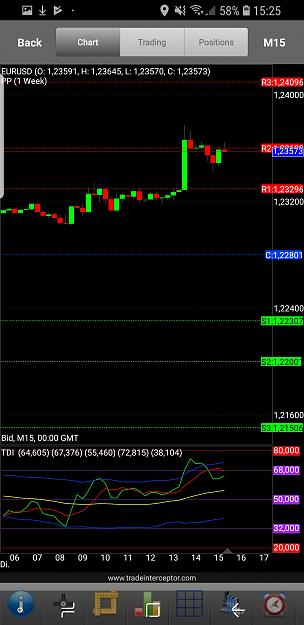
Looks good, these are my levels and TDI values. Slight deviations from broker to broker are normal. image Just noticed minor deviations in your pivot levels. The 3rd digits in your 38 and 61 levels should be 38.2 and 61.8. Check the screenshot in ...
Pivot Trading
- mkuefne replied May 12, 2018
Sure! 1. Calculate Weekly Pivot Point WPP = (H+L+C)/3 and R100 = WPP+H-L using high, low and close price from the latest completed weekly candle. Write down both prices on a piece of paper. 2. Select the 'Objects' Tool in MT4 Mobile App by clicking ...
Pivot Trading


- mkuefne replied May 11, 2018
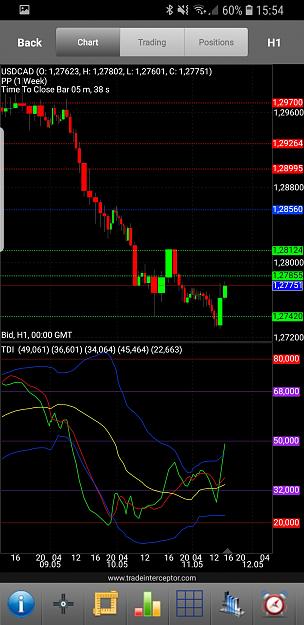
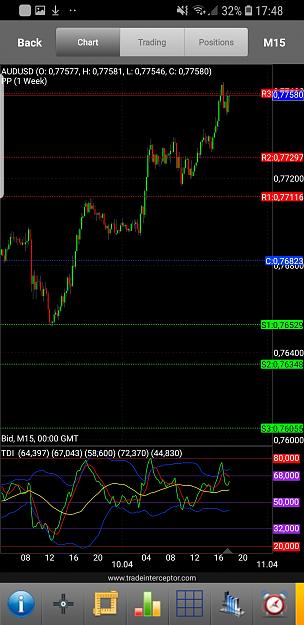
Hi griffinssoul, based on your method I was able to add the weekly fibo levels on the UC chart of my MT4 mobile trading platform with very small effort. I also used Hanovers approach to draw the 2 important TDI lines in the indicator window as ...
Pivot Trading
- mkuefne replied May 11, 2018
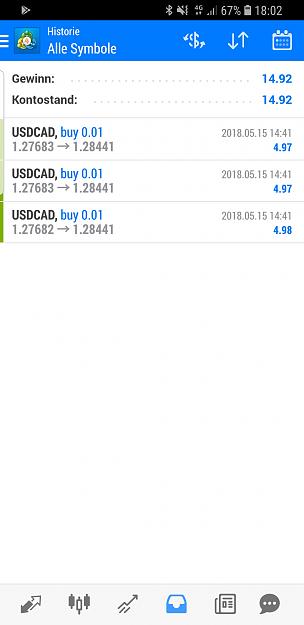
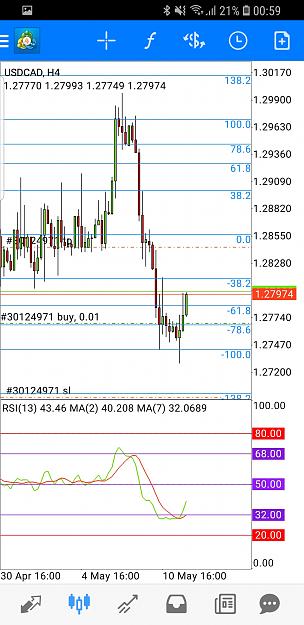
UC has been rejected from S3 (=S100). I opened UC long at 1.2768 after big volume 1H candle was closed. My TP is just below weekly Pivot at 1.2844 and my SL is just below S138 at 1.2695.
Pivot Trading
- mkuefne replied Apr 27, 2018
Closed my EA shorts as price almost reached weekly Pivot.
Pivot Trading

- mkuefne replied Apr 10, 2018
AU at weekly R3 now (=R100). If price will be rejected from this line I will jump in for a short.
Pivot Trading
- mkuefne replied Apr 10, 2018
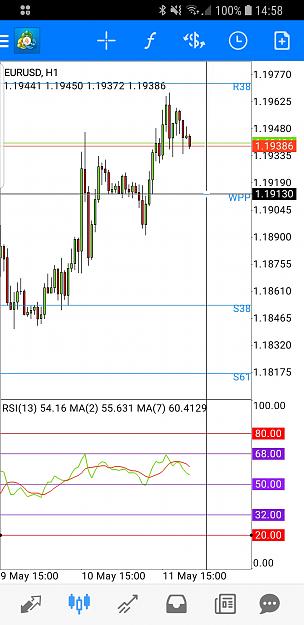
EU at weekly R2 (=R61) now. Closed my EU longs here and watch out for possible short entry.
Pivot Trading
- mkuefne replied Apr 9, 2018
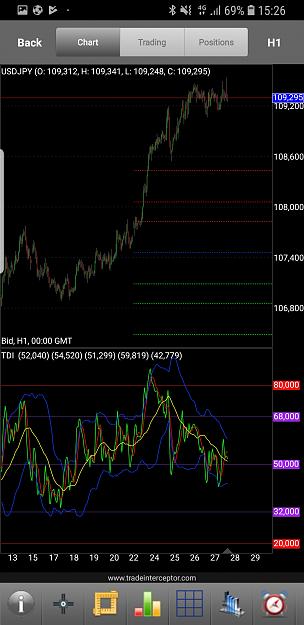
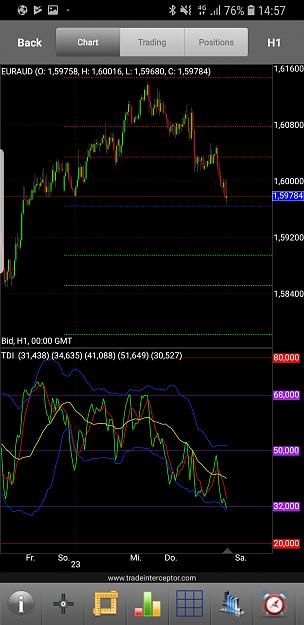
GBPAUD at R2 currently. Something to watch in case TDI pointing down? image
Pivot Trading

- mkuefne replied Sep 4, 2016
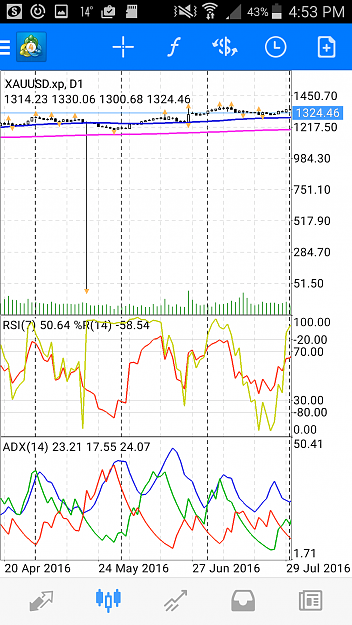
Synergy Financial Markets Pty Ltd. is a STP broker which seems to use chart manipulation. Look at the screenshot: according to their chart Gold spiked down to 50 dollars on 19th May 2016. Seems that they didn't like the fact that too many traders ...
Reality of FOREX: my experience with brokers + share yours
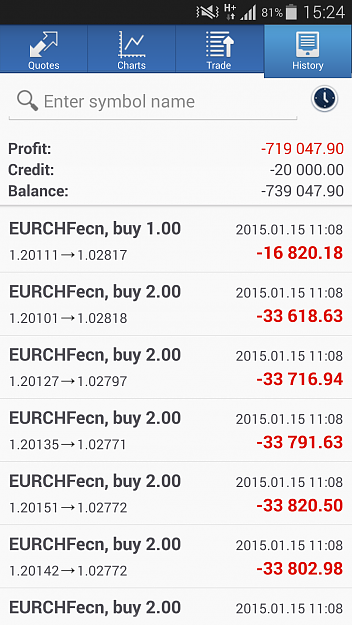
- mkuefne replied Jan 17, 2015
Ouch.... do you think I can convince my Broker that these trades are not valid? :-D
EUR/CHF