- Search Forex Factory
- 74 Results
- irongoose replied Mar 9, 2015
Dangit if I didn't miss a great opportunity for a good trade today. Looking at the chart below we get a perfect M pattern into 1.08999 and a engulfing candle down after price tests the 108999 level, this ran for just over 50 pips!
EURUSD I would ...

- irongoose replied Jan 15, 2015
I'm sure there are parts of the forex battle field that look like this right now.
EURUSD
- irongoose replied Jan 14, 2015
I didn't know what any of this means but it sure makes me look like a trading guru. :nerd:
EURUSD

- irongoose replied Jan 5, 2015
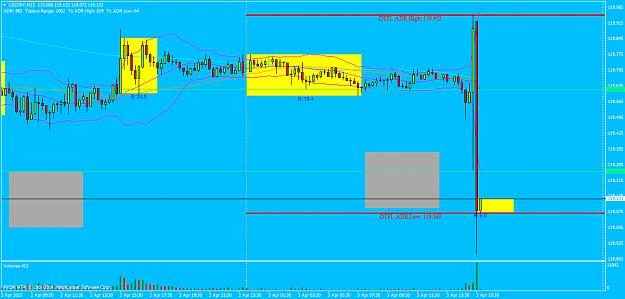
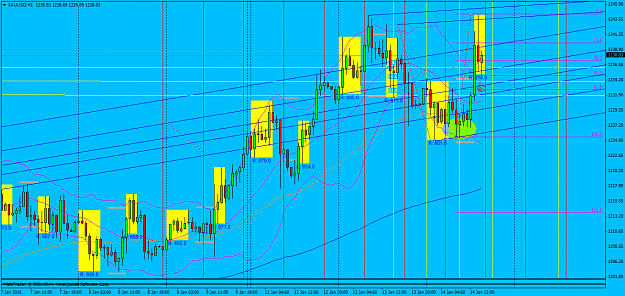
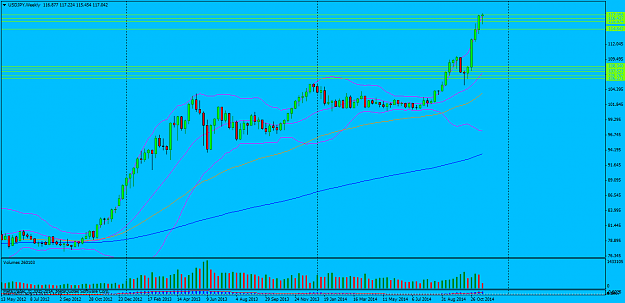
Looking at my chart I believe the 119.00 level looks like a very interesting level to long from for several reasons.................. first the bottom Bollinger band is around it and second the 200 MA and third the 119.00 level has had a lot of ...
USD/JPY Discussion
- irongoose replied Dec 10, 2014
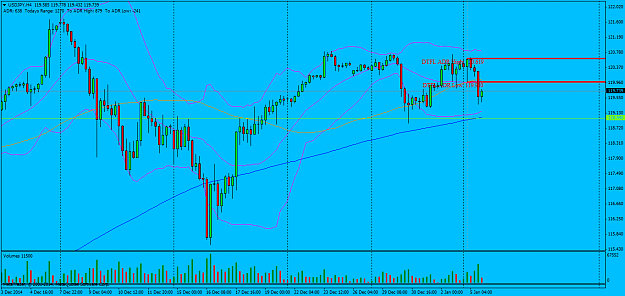
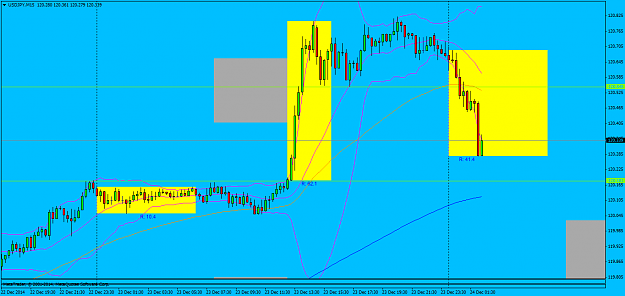
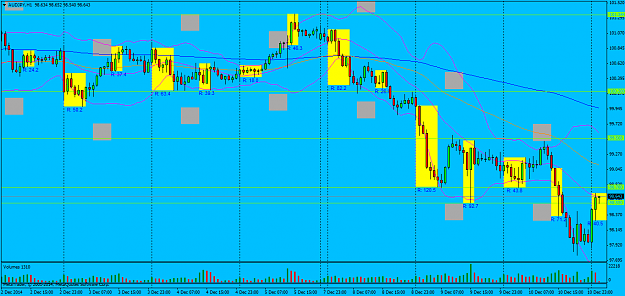
Looking at my charts I spotted a couple interesting levels to keep an eye on for a future trade in The Aud/Jpy. I believe .9950 and 100.21 are good levels where there maybe lots of orders siting and good levels to short from should we see a clear ...
AUD/USD
- irongoose replied Nov 20, 2014
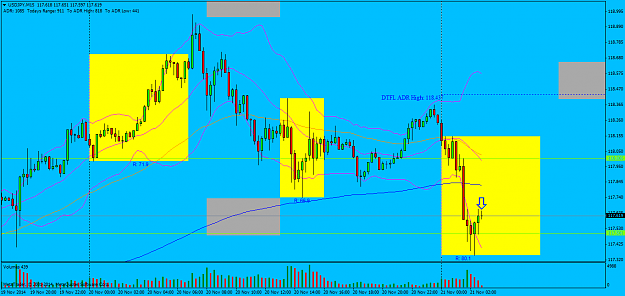
I'm looking for a low volume retest of 117.50 on this candle for a long.
USD/JPY Discussion
- irongoose replied Nov 18, 2014
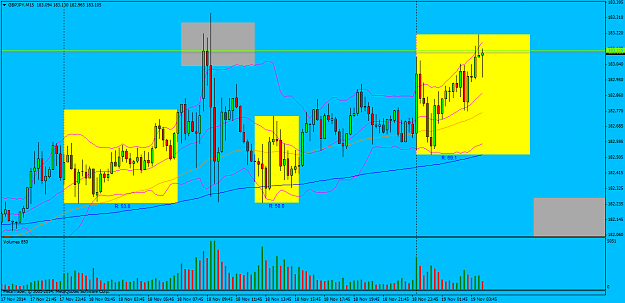
We might get a good setup for a short here on the GBP/JPY.
USD/JPY Discussion
- irongoose replied Nov 18, 2014
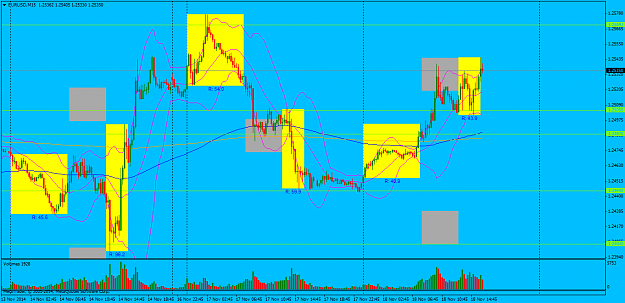
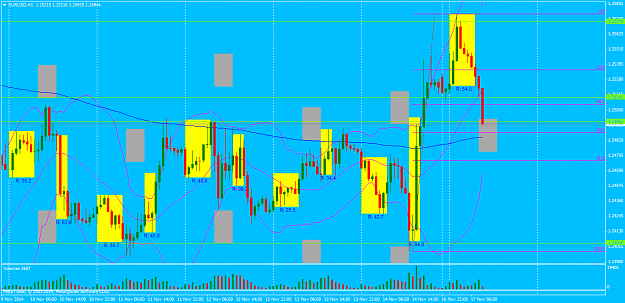
I'm not sure where price will go from here but I'm done for the day and I expect price to stay around where its at now 1.2540 and bounce between there and 1.2500 the rest of the day. Perhaps tomorrow they will make a run at the 1.2570 level and take ...
EURUSD
- irongoose replied Nov 17, 2014
1.2496 level 200 EMA and 50% fib all with in 11 pips of each other, could get a continuation to the upside from this point as the banksters run possible stops in this area.
EURUSD
- irongoose replied Nov 12, 2014
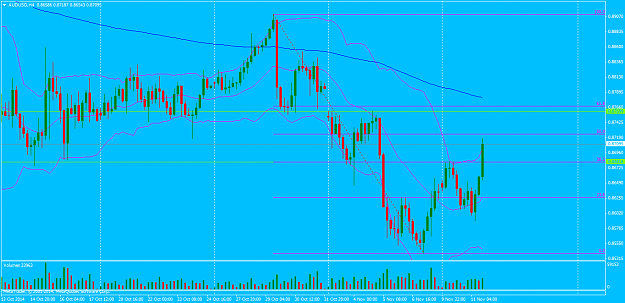
I posted this yesterday on this blog about the .8760 level could be a turning point in price and a good area to go short from. There should be lots of orders sitting up there when you consider the recent activity on both sides of .8760, that and the ...
AUD/USD
- irongoose replied Nov 11, 2014
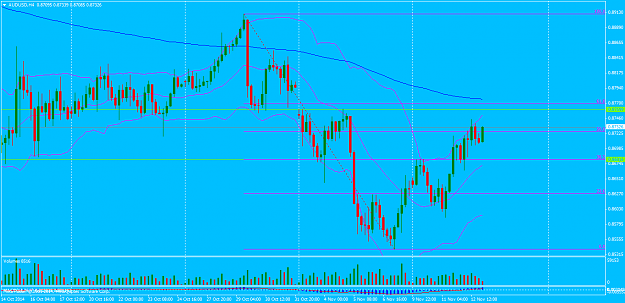
Looking at my 4 hour chart I really like what I'm seeing at and around the .8760 level, we have the 61.8 fib there plus the 200 DMA closing in on that area and lots of reaction in the past to .8760 level, what this all means is a potential short!
AUD/USD
- irongoose replied Nov 5, 2014
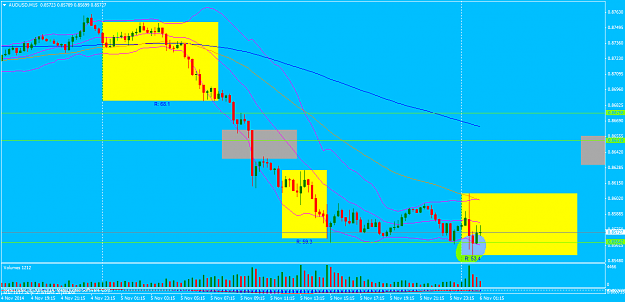
I'm reading a lot of people saying short the AUD but it looks like at least in the short term price might go up on The Aud/USD because they ran the lows of the NY session and if we get a pull back close to the lows with a low volume candle might be ...
AUD/USD
- irongoose replied Sep 16, 2014
I watched this mess all morning just to not take a trade.
Geppy's Geppy Thread (GBP/JPY)

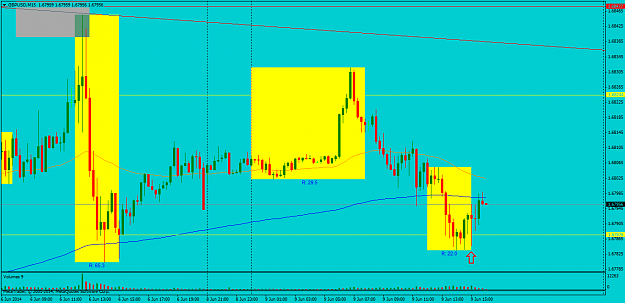
- irongoose replied Jun 9, 2014
Wow The Pound is just screaming of a long, wished I had been watching where the arrow is on my chart because I would have entered long there with a stop right at the lows.
Cable Update (GBPUSD)
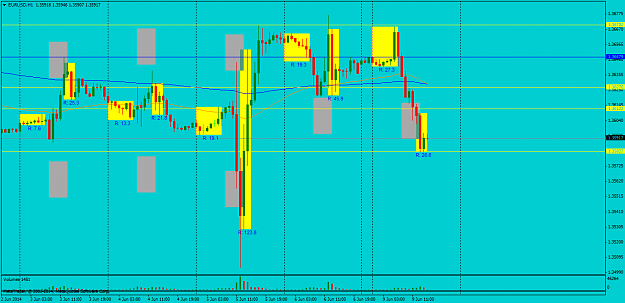
- irongoose replied Jun 9, 2014
Not much holding the Euro up at this point, if it breaks this level it could really run south for quite a bit. Pins and needles for now though.
EURUSD