- Search Forex Factory
- 356 Results
-
 gespiri replied Nov 10, 2023
For those who are old enough to know that this is pure bullshit.... image image image image image image image They tried with SARS, Covid, phony pandemics....and they're gonna try again next year due to the US elections. image image
Cable Update (GBPUSD)


- gespiri replied Sep 14, 2023
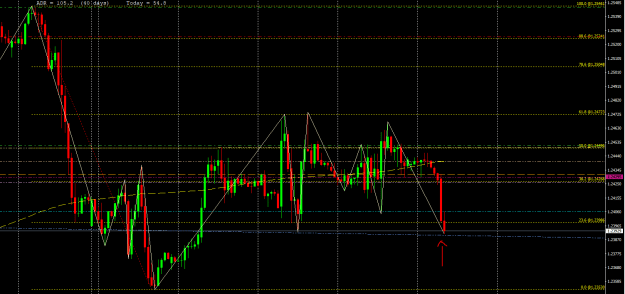
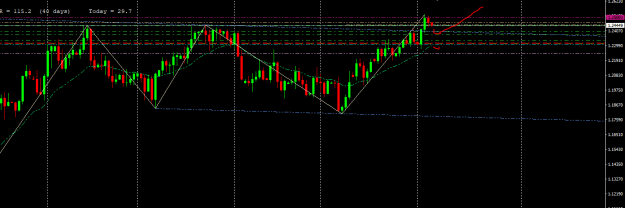
My play for today: will wait to short around yesterday's high to end the week with a red candle. image
Cable Update (GBPUSD)
- gespiri replied Sep 14, 2023
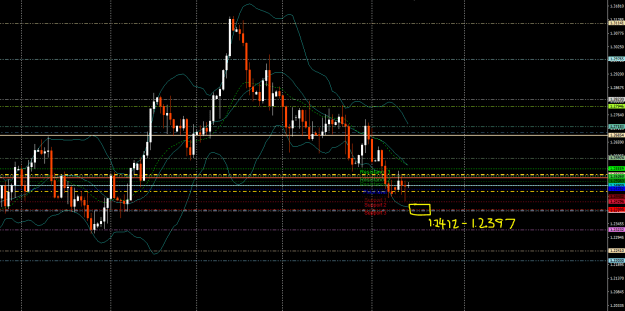
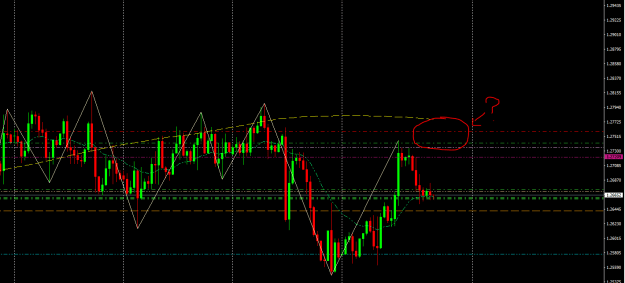
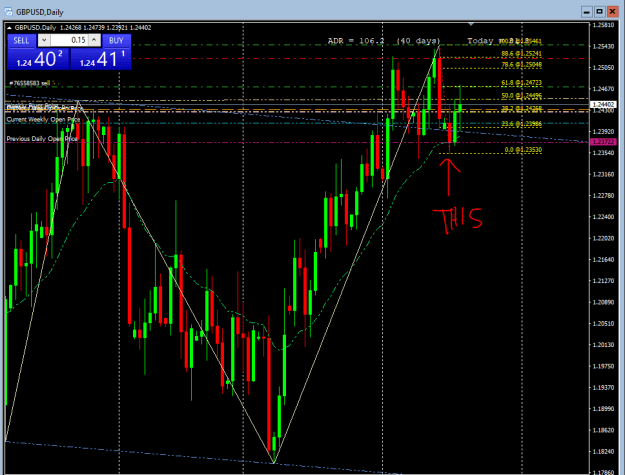
Update: We are in the middle of tranny land right now. Prices hit 1.2445 then proceeded to hit 1.2547 on Monday. It failed a retest of last week's low at 1.2445 yesterday so I see the daily lower BB at 1.2412 and/or the weekly S1 at 1.2397 as a ...
Cable Update (GBPUSD)
- gespiri replied Sep 7, 2023
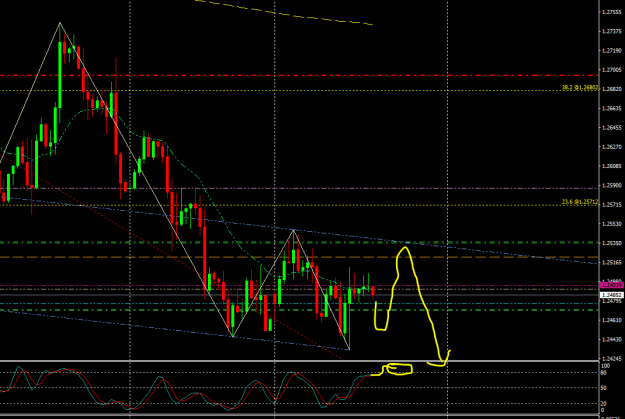
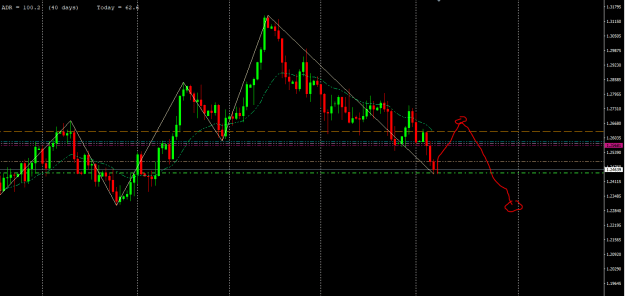
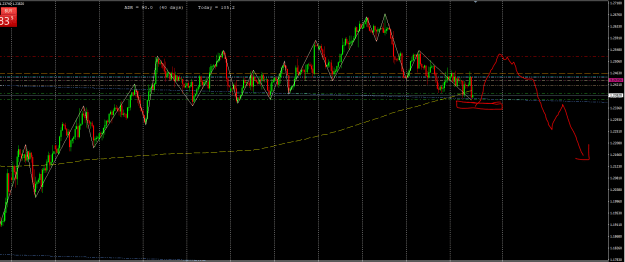
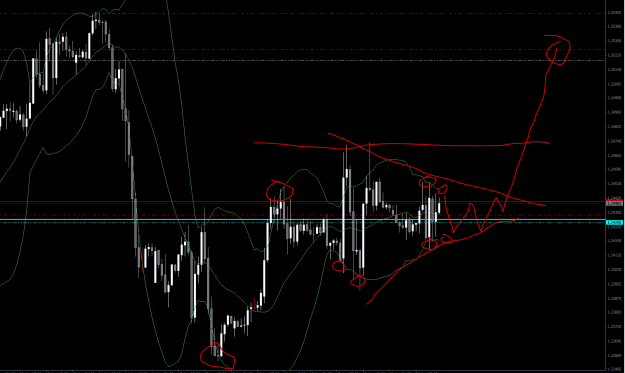
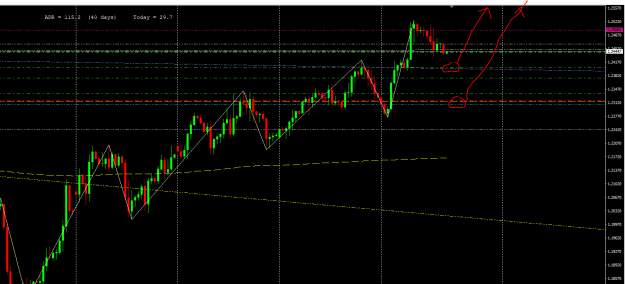
My strategy: 1) Hold buys until +90-+130 from lows, 2) wait for retest of lows which I expect it will hold, 3) short around 1.27 until 1.23 for the rest of the month. We'll keep watching. image
Cable Update (GBPUSD)
- gespiri replied Sep 6, 2023
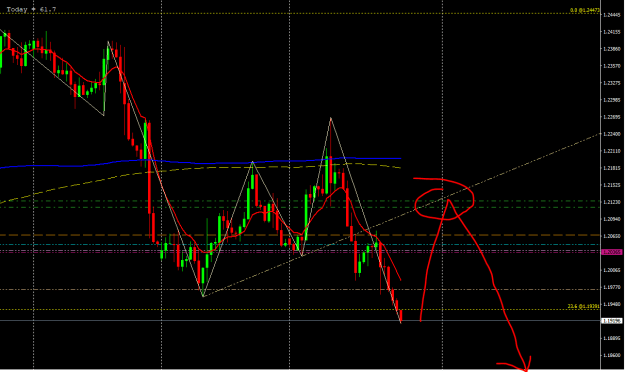
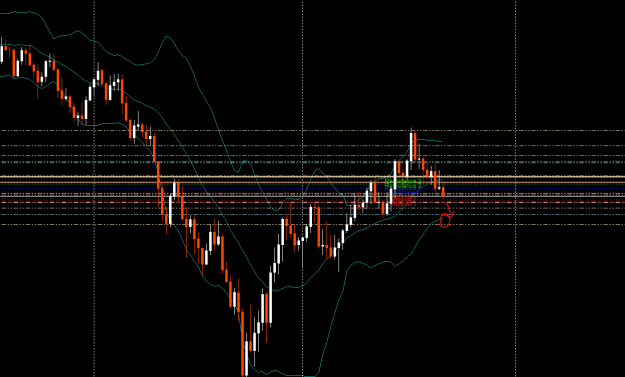
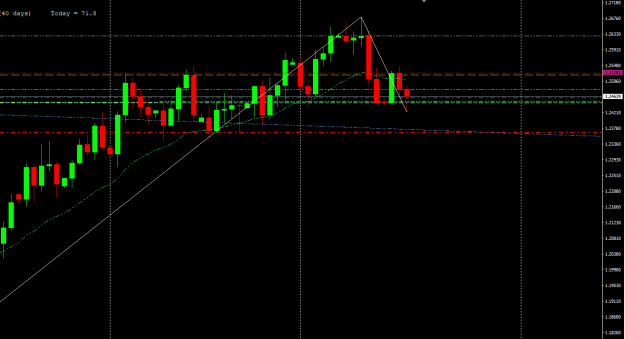
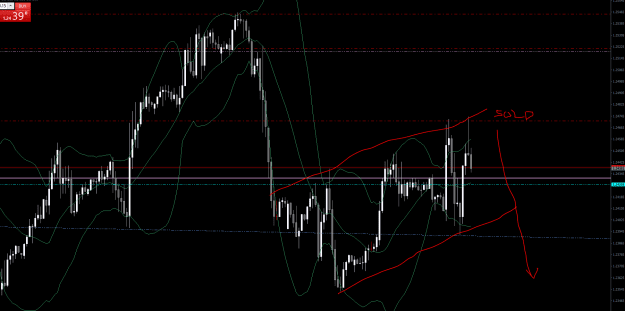
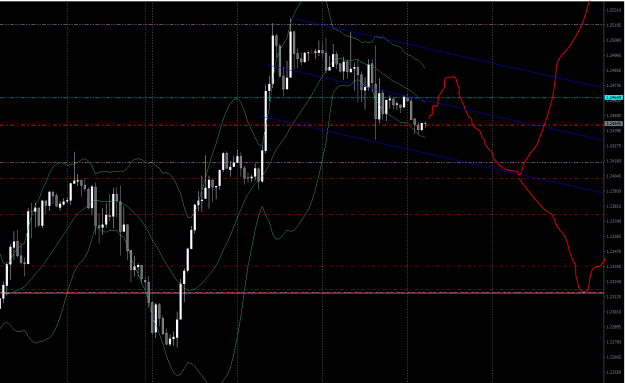
I’ll wait for a retest to commit to a corrective BUY tomorrow LO. I have 1.2446 as a reversal up before hitting 1.2305 (weekly BB). image
Cable Update (GBPUSD)
- gespiri replied Sep 1, 2023
On 4hr chart, if this can only retest this week's high or even the LQ zone, we might see a drop today or tomorrow.....or not. image Daily, WK, and MN chart look bearish to me.....we'll wait and see.
Cable Update (GBPUSD)
- gespiri replied Aug 31, 2023
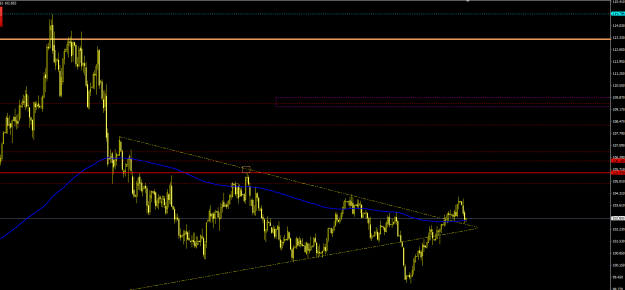
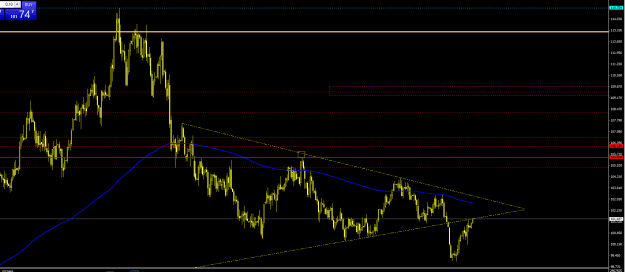
Interesting daily USDX chart. Let's see what happens in Sept.
Cable Update (GBPUSD)
- gespiri replied Aug 30, 2023
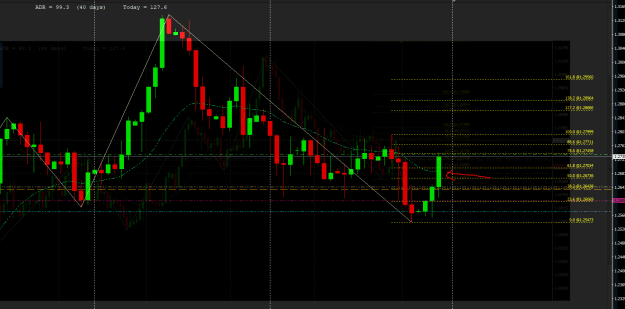
As long as this closes today and tomorrow below 1.2696 (daily 21EMA), the downtrend is intact IMO. image
Cable Update (GBPUSD)
- gespiri replied Aug 24, 2023
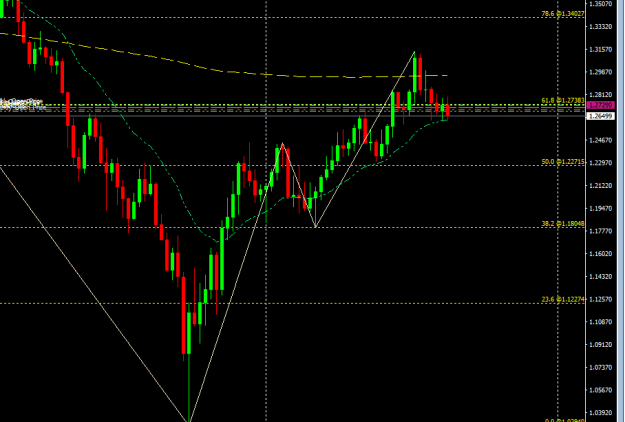
This is weekly. If price close below the dotted line (21EMA), then it confirms the down trend. image
Cable Update (GBPUSD)
- gespiri replied Jul 13, 2023
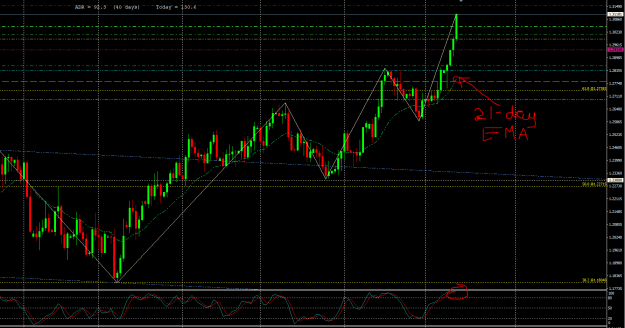
As long as prices are above the 21-day EMA line, it's bullish for me. If it does correct from around here, it should bottom at around 1.2738-1.2750. A solid break and daily close below the line might indicate a trend change. image
Cable Update (GBPUSD)
- gespiri replied May 24, 2023
This is 4hr (you can also see it on the daily). Around 1.2320-1.2344 a possible reversal to complete the right shoulder at 1.2535 for me in the coming days/weeks. Let's wait and see.
Cable Update (GBPUSD)
- gespiri replied May 17, 2023
Pat, for me the trend has shifted bearish since: 1) yesterday's close was below daily 21ema (dotted green line), 2) targetting the blue trendline of 1.2367 which is also close to the weekly support 1 of 1.2364. I expect the MPP of 1.2470 as a good ...
Cable Update (GBPUSD)
- gespiri replied May 2, 2023
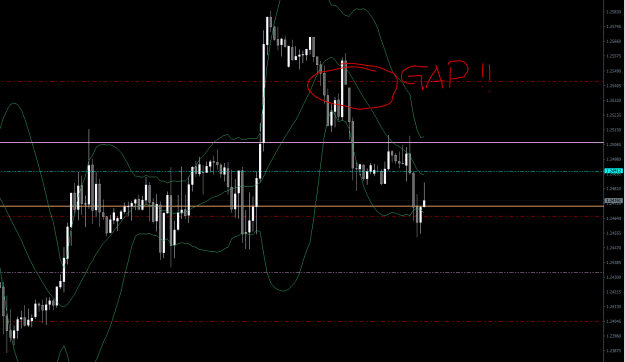
I'm not recommending anything but in case of a spike up, watch out for this gap on the 1hr before heading south. image
Cable Update (GBPUSD)
- gespiri replied Apr 21, 2023
Stopped out. An old trendline on the daily at 1.2389 which I forgot to check. If broken, then it goes to 1.2300.
Cable Update (GBPUSD)
- gespiri replied Apr 20, 2023
Days like these (consolidation and compression), I use the 1hr or 4hr Bollingers....20-30pips. image Now's not the time IMO. This is ready to do a fake spike then take off......I'm thinking a fake down then up in about 2-3 hours. Let's see what ...
Cable Update (GBPUSD)
- gespiri replied Apr 19, 2023
My overall bias has changed to short since based on what happened last Friday. I bought this afternoon at 1.2395 earlier and sold it now for NY/Tokyo session. image I'm looking at that green line (21EMA daily) which is my trend indicator). We ...
Cable Update (GBPUSD)
- gespiri replied Apr 6, 2023
Possible bounce: Daily image 4hr image 1hr image If true, by tomorrow for a Friday surprise. Let's see and use SLs.
Cable Update (GBPUSD)
- gespiri replied Feb 19, 2023
image Enough already....you sound like my 12 yr. old daughter and her friends.
Cable Update (GBPUSD)

- gespiri replied Feb 17, 2023
If it does retrace at this point, I don't think it'll go over that level. We'll wait and see. image
Cable Update (GBPUSD)