- Search Forex Factory
- 135 Results (1 Thread , 134 Replies )
-
 VSATrading replied Jan 19, 2023
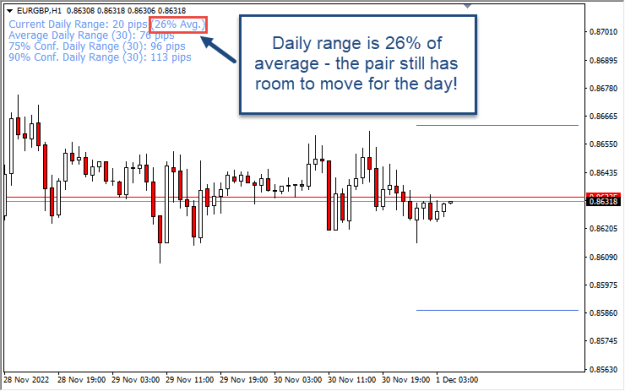
New article released + free ADR indicator Indicator download: Download AT - Daily Range + 5 other indicators for free Article: How to use the Average Daily Range in Forex The average daily range (ADR) is an indicator that shows you the historical ...
Analytical VSA Trader - Trading with Volume Spread Analysis
- VSATrading replied Nov 16, 2022
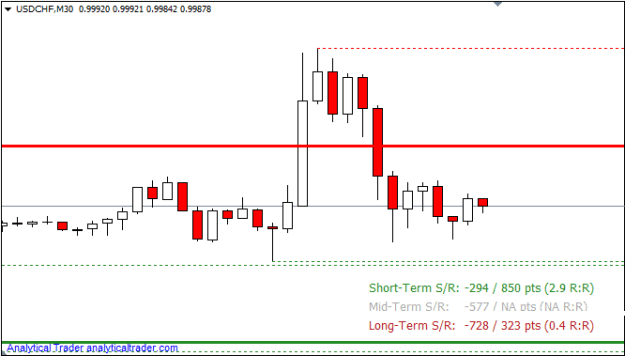
We are excited to announce that we launched a new indicator – Supports/Resistances Pro. This indicator for MT4 adds functionalities to our free S/R indicator: Draws supports/resistances automatically (short, mid and long-term) Shows the risk:reward ...
Analytical VSA Trader - Trading with Volume Spread Analysis
- VSATrading replied Oct 21, 2022
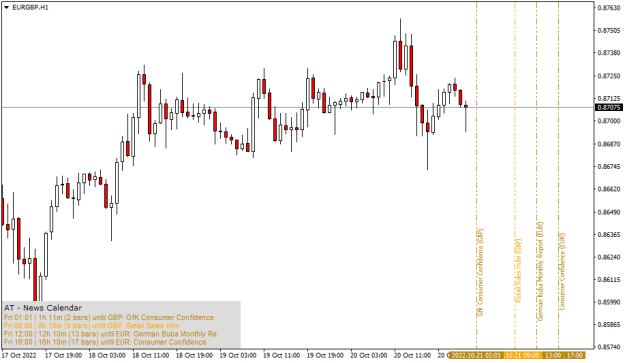
We updated the AT – News Indicator for MT4 (Metatrader 4) : Fixed a bug where news weren’t being retrieved Added vertical lines with a label to highlight the news events Added the news event’s day of week/hours, in your local time image Just as ...
Analytical VSA Trader - Trading with Volume Spread Analysis
- VSATrading replied Oct 16, 2022
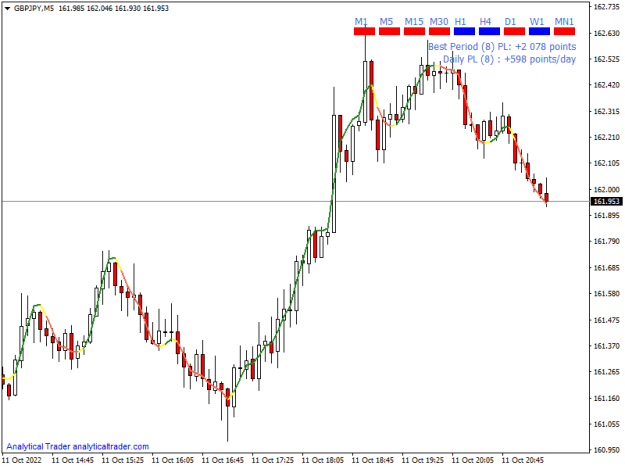
New free and premium products coming up! We will also start providing regular pair analysis using our tools in our blog and here. Meanwhile you can download our free indicators for Metatrader 4 here and/or try our demo here. Stay tuned!
Analytical VSA Trader - Trading with Volume Spread Analysis
- VSATrading replied Dec 24, 2016
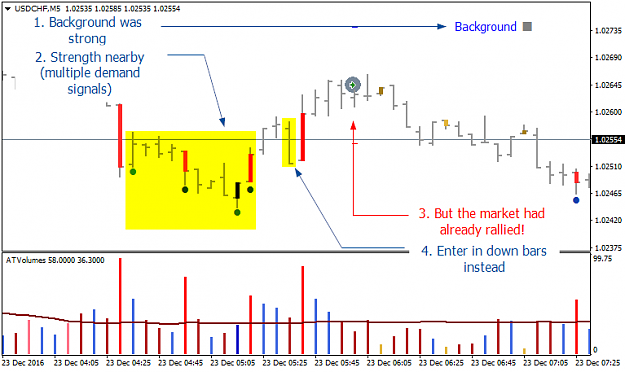
When to Enter in a Trade (Trade Review) - USD/CHF M5 image USD/CHF Trade Revi This trade was taken in the 5 minutes time frame at the today's London session. There were 2 things going for the trade: The background was strong at the time There were ...
Analytical VSA Trader - Trading with Volume Spread Analysis
- VSATrading replied Dec 21, 2016
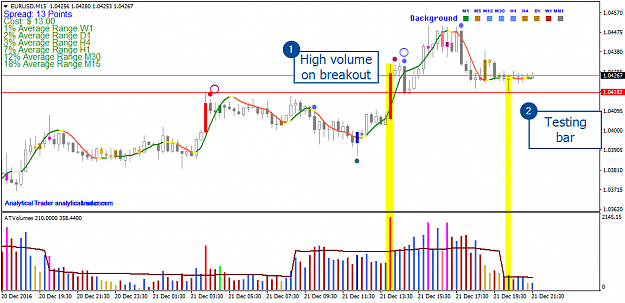
Background (15 minutes): Strong Support: 1.0400 Resistance: 1.0479 image Euro/Dollar just broke out from an important accumulation pattern of the last few sessions, that peaked at 1.0418. At point 1, we can see that the breakout was on good ...
Analytical VSA Trader - Trading with Volume Spread Analysis
- VSATrading replied Dec 19, 2016
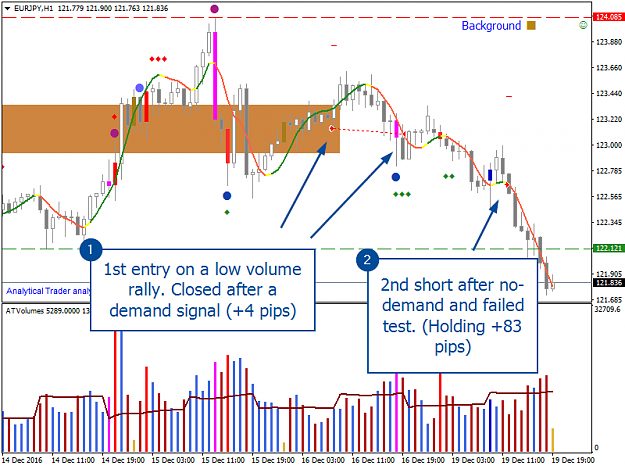
Euro/Yen's Bounce Off Resistance on the Hourly Background: Weak Entry reason (1st trade): Low volume up bar on resistance, with weakness behind Close reason (1st trade): Demand signal Entry reason (2nd trade): Low volume up bar and failed test ...
Analytical VSA Trader - Trading with Volume Spread Analysis
- VSATrading replied Dec 19, 2016
Euro/Yens Bounce Off Resistance on the Hourly url Background: Weak Entry reason (1st trade): Low volume up bar on resistance, with weakness behind Close reason (1st trade): Demand signal Entry reason (2nd trade): Low volume up bar and failed test ...
Analytical VSA Trader - Trading with Volume Spread Analysis

- VSATrading replied Dec 15, 2016
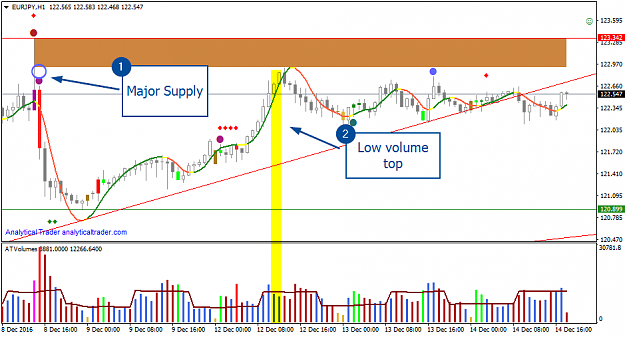
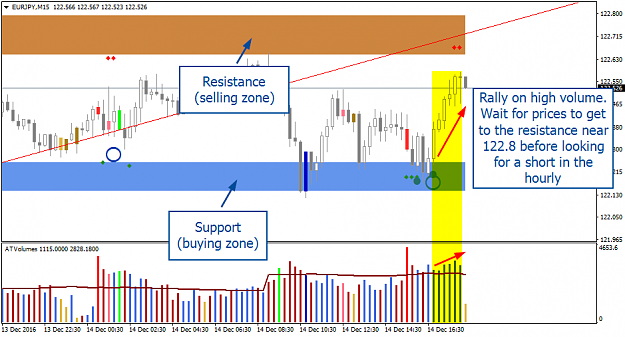
Euro/Yen 2-Week Trend is Broken - What's Next? Hourly Trend: Down Resistance: 122.800 Support: 122.142 Euro/Yen Hourly image Euro/Yen Hourly - Trend Changing Euro/Yen's been trending for the past 2 weeks, but on today's Tokyo session, the up ...
Analytical VSA Trader - Trading with Volume Spread Analysis
- VSATrading replied Dec 7, 2016
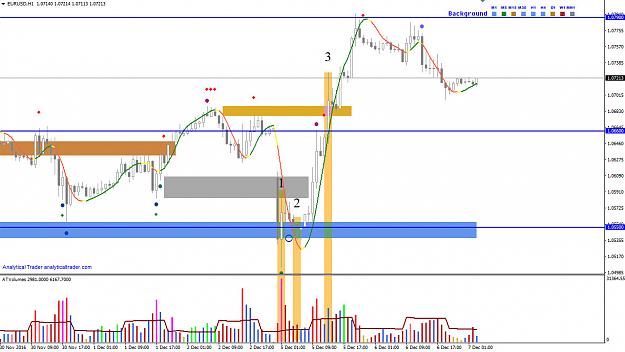
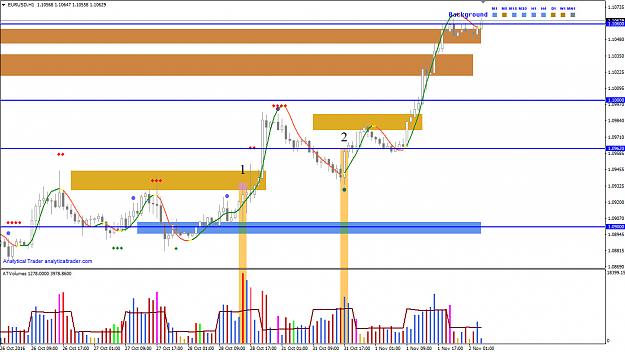
Will EUR Rise Over USD? Dynamic trend: Turned up Background: W1 very weak; D1 weak Phase: Markup Support: 1.066 Resistance: 1.079 image Considerations Point 1: We can observe "Shakeout" with very large volume and a wide range, on a weak congestion ...
Analytical VSA Trader - Trading with Volume Spread Analysis
- VSATrading replied Dec 5, 2016
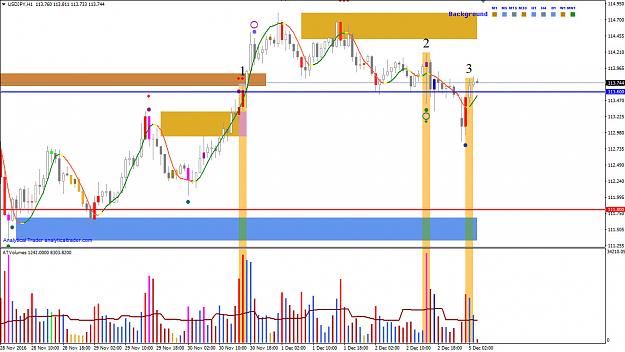
Dynamic trend: Turned up Background: W1 weak; D1 strong Phase: Markup Support: 113.60 Resistance: 116.00 image JPYUSD: Hourly Observations Point 1: There was a breakout of the resistance level, with an average range and a high volume. The ...
Analytical VSA Trader - Trading with Volume Spread Analysis
- VSATrading replied Nov 28, 2016
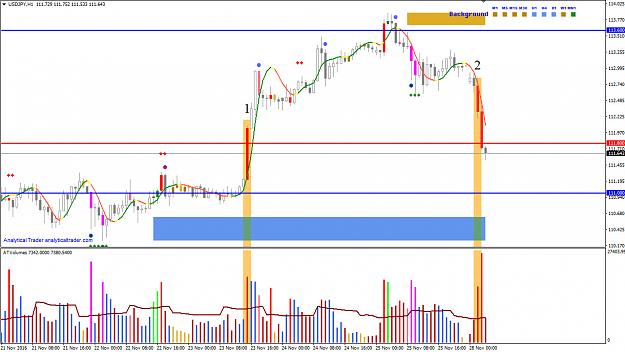
Dynamic trend: Turned up Background: W1 weak; D1 strong Phase: Markup Support: 111.80; 111.00 Resistance: 113.60 Analysis Point 1: There was a breakout of the resistance level with a wide range and a high volume bar. The following up-bar confirmed ...
Analytical VSA Trader - Trading with Volume Spread Analysis
- VSATrading replied Nov 23, 2016
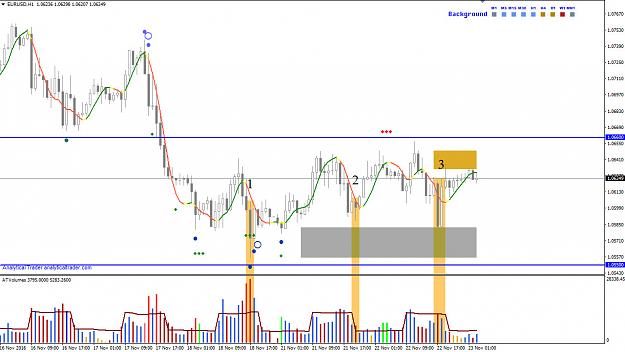
EURUSD: Markdown Dynamic trend: Turned up Background: W1 very weak; D1 weak Phase: Markdown Support: 1.055 Resistance: 1.066 image EURUSD Hourly Point 1: There was a potential Selling Climax", with a very high volume and a wide range. The ...
Analytical VSA Trader - Trading with Volume Spread Analysis
- VSATrading replied Nov 7, 2016
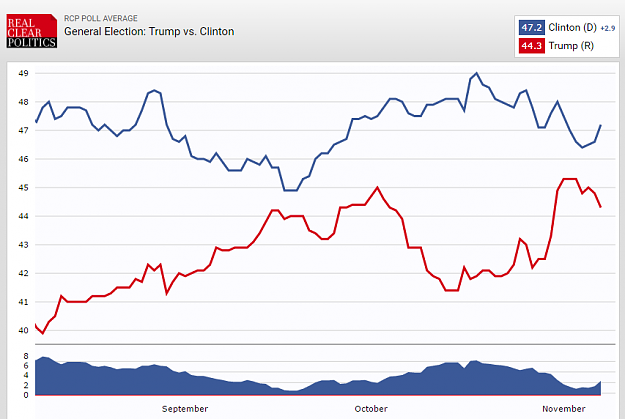
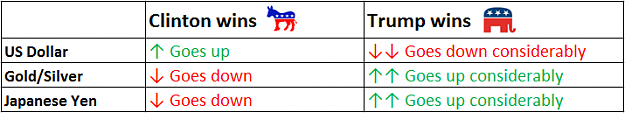
Tomorrow, on 8th November, the US presidential elections begin. Up until now, the dispute on the presidential race between Hillary Clinton and Donald Trump has been a fierce battle. The polls have been mostly in favor of Hillary, although Trump has ...
Analytical VSA Trader - Trading with Volume Spread Analysis
- VSATrading replied Nov 2, 2016
HOURLY In point 1 there was an up bar, that looked like a “Shakeout”, with a very high volume and an average range. This is a pattern that shows demand, and on a critical point, approaching the weak congestion zone ahead. In point 2 there was the ...
Analytical VSA Trader - Trading with Volume Spread Analysis
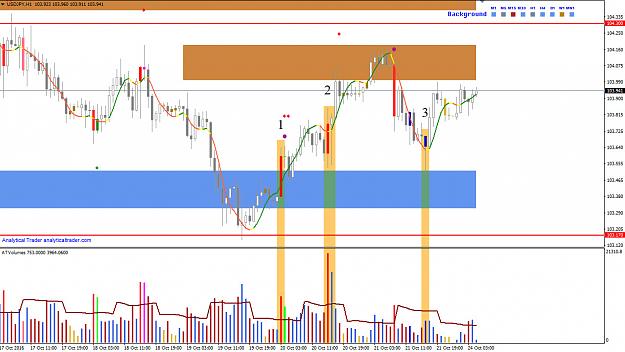
- VSATrading replied Oct 24, 2016
Since the previous analysis, the price continues to remain in the trading range 103.17 – 104.30, with congestion zones formed in between. Point 1 was the breakup up-bar of a strong congestion zone. In the 15 minutes timeframe, there were also clear ...
Analytical VSA Trader - Trading with Volume Spread Analysis
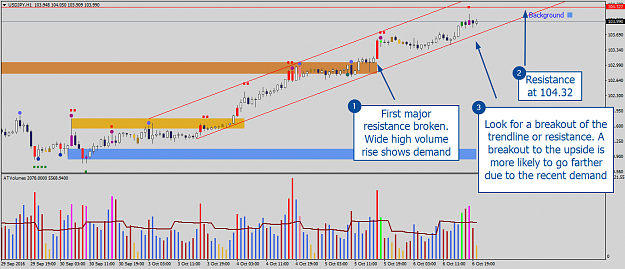
- VSATrading replied Oct 6, 2016
Tomorrow at 1:30pm BST the NFP and unemployment numbers are being released, which could provide the breakout of critical levels in USD pairs, such as in USD/Yen. Read more: url image
Analytical VSA Trader - Trading with Volume Spread Analysis
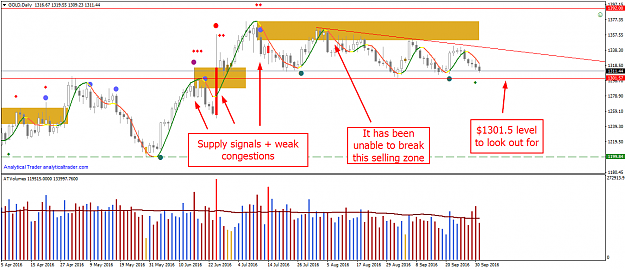
- VSATrading replied Oct 3, 2016
After major supply knocked off the precious metals on a sideways trend, gold prices have been oscillating, with no clear direction. Silver on the other hand, has been slightly weaker, with a defined downtrend. The most visible supply bar was the ...
Analytical VSA Trader - Trading with Volume Spread Analysis
- VSATrading replied Sep 23, 2016
Before Wednesday’s FOMC statement, USDCAD started showing supply signs above a strong zone. On the FOMC’s statement release, there was a rally, but the prices quickly tumbled, forming what we call an ‘upthrust’, on very high volume. This is what we ...
Analytical VSA Trader - Trading with Volume Spread Analysis
![Click to Enlarge
Name: EURUSD,M15].png
Size: 33 KB](/attachment/image/2024673/thumbnail?d=1474651634)
- VSATrading replied Sep 23, 2016
Hi, at the time, yes, and it actually coinceded with a weak zone. After a downturn there was more accumulation towards 1.112 level and it was broken shortly after. Check attached pic image
Analytical VSA Trader - Trading with Volume Spread Analysis
![Click to Enlarge
Name: EURUSD,M15].png
Size: 33 KB](/attachment/image/2024672/thumbnail?d=1474651579)