- Search Forex Factory
- 188 Results
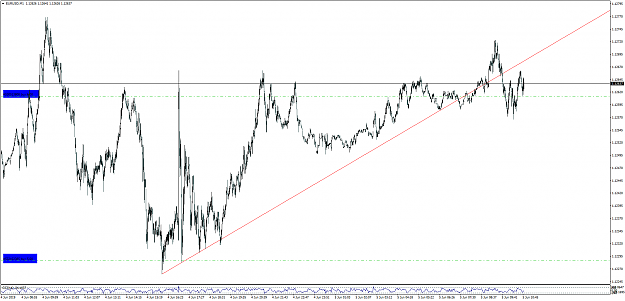
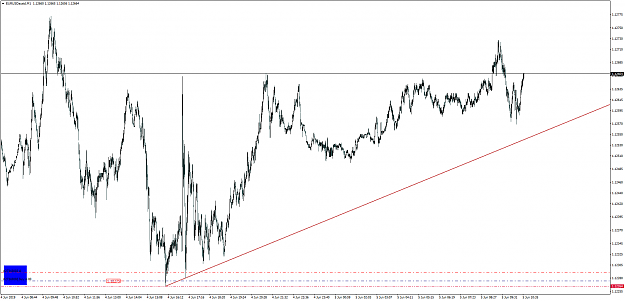
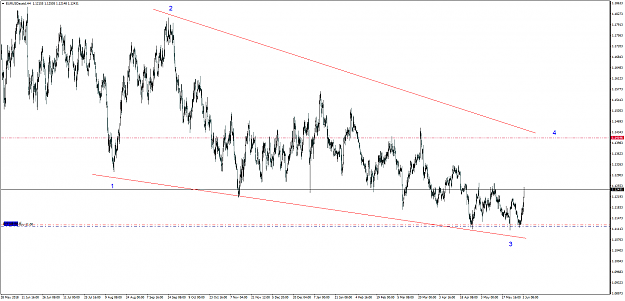
- Rocroy replied Jun 5, 2019
same trendline, but data from different broker... this is no longer valid... image
EURUSD only
- Rocroy replied Jun 5, 2019
i think that is a valid conclusion, till that trendline is broken. but when you draw trendlines, be careful... and also consider, that different brokers offer slightly different data, which causes differences to trendlines, at least in small tf's... ...
EURUSD only
- Rocroy replied Dec 12, 2011
Yep, but when price is trending oscillators like cci or stochs are quite useless. They are all the time proposing counter trend trades - not good. You need other strategies to make pips during trends. Here is my 4h euro chart as an example of other ...
TASAYC System
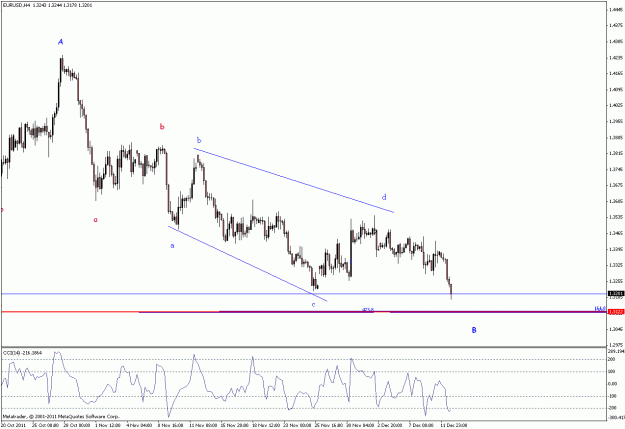
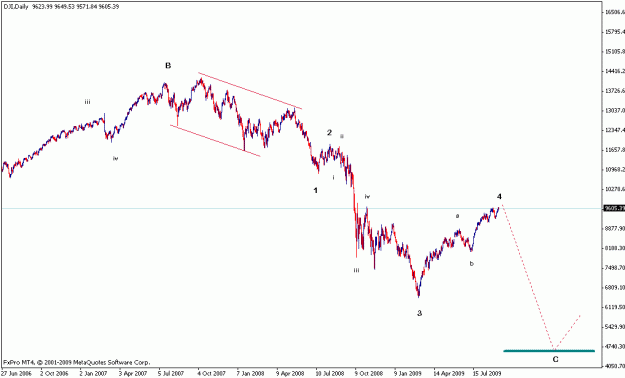
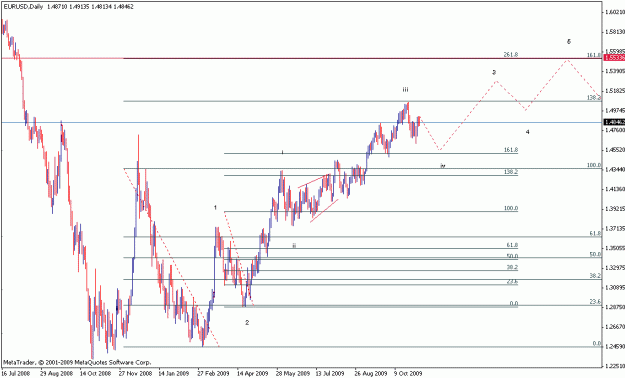
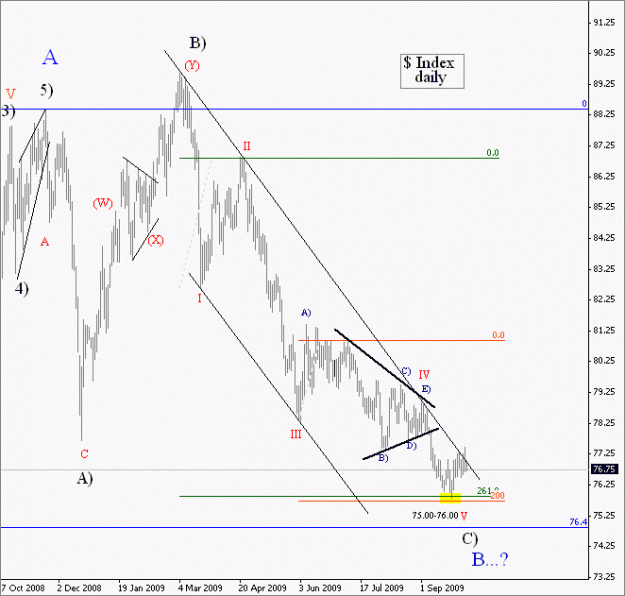
- Rocroy replied Apr 6, 2010
I'm expecting a move higher, to 1235-1250 area, which very likely is the top for the current wave starting from mid 1999. image
Elliott Wave Trading
- Rocroy replied Apr 1, 2010
EUR$ — Many possibilities still open, "A" could be a triangle... It could also be that your big count is not correct, we could have an extended 3 here - that is why there's "2" on my chart. On the other hand, break of major down trendline ...
Elliott Wave Trading
- Rocroy replied Dec 2, 2009
Very nice charts, almost like my counts
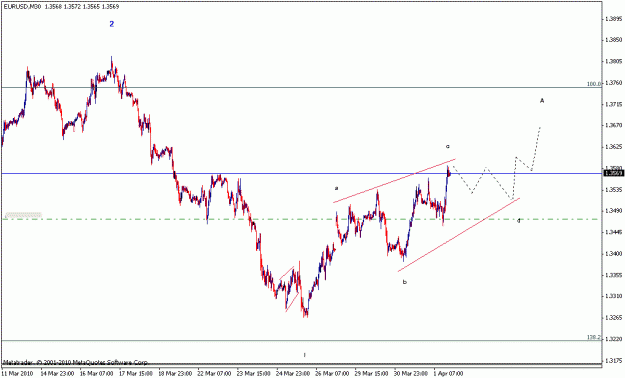
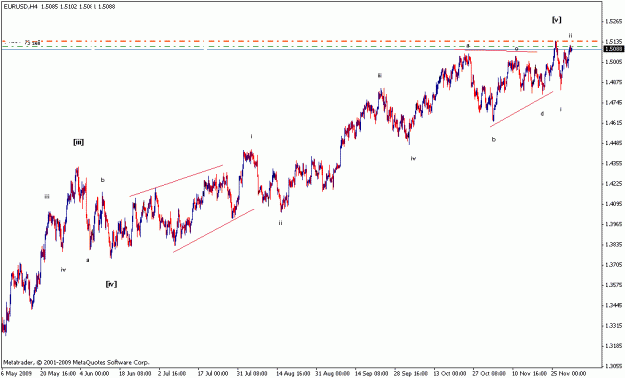
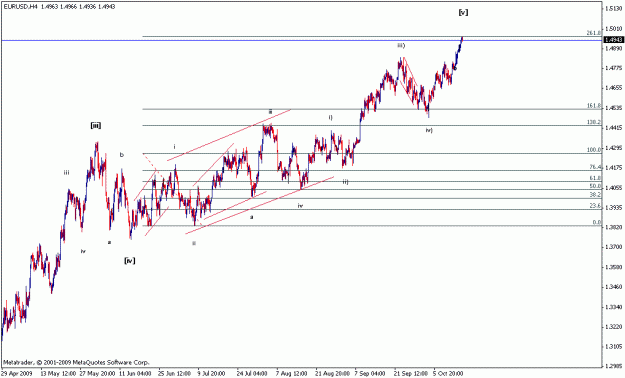
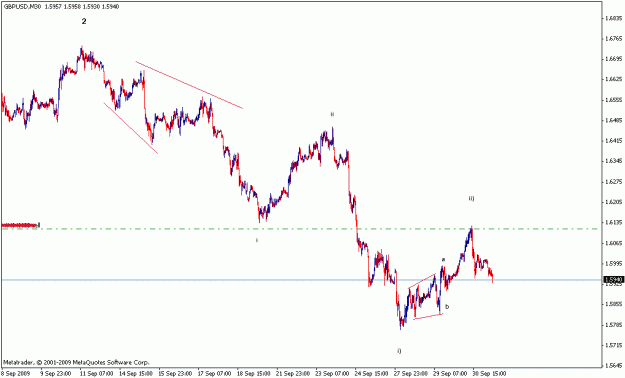
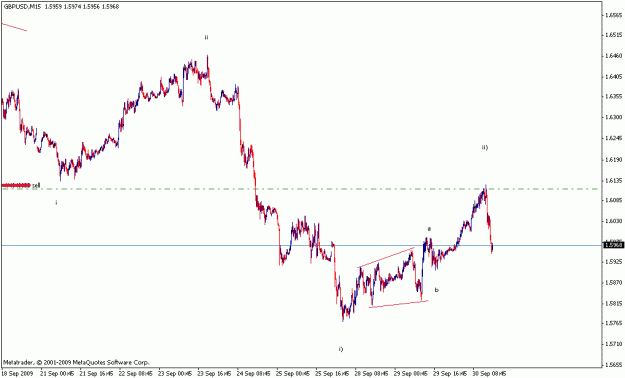
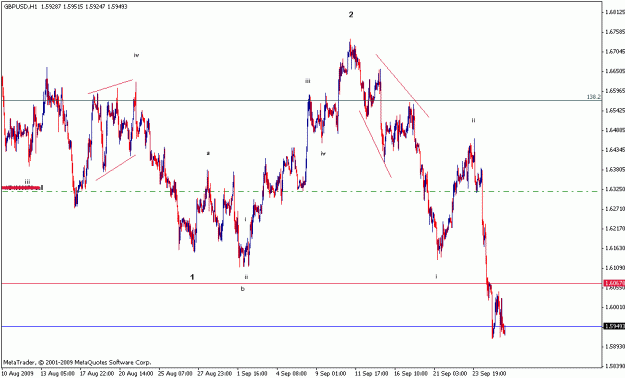
Elliott Wave Trading I'm too keeping an eye on euro's ending diagonal, and this next in fact suggests that wave is complete. Let's see how it goes. Cable also looks like it is ready for shorting. image
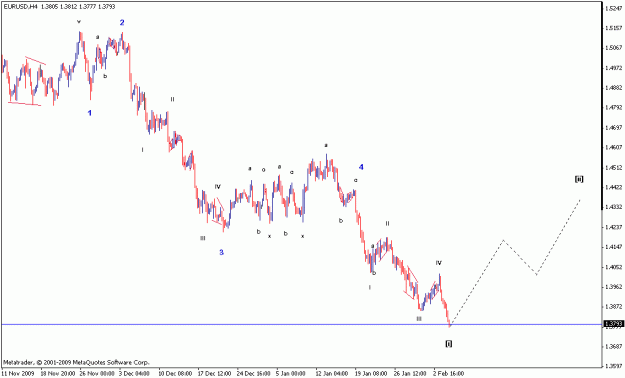
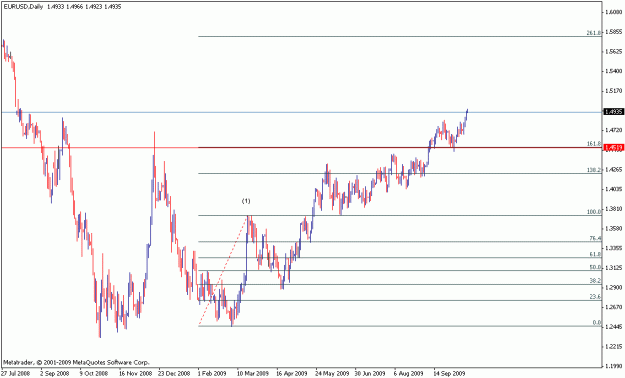
- Rocroy replied Nov 8, 2009
EUR$ — Now that euro broke the strong resistance at 1.47-1.48, it is going to be bullish for a while. The next potential stop is at 1.55, and this uptrend will probably change the big count too. image
Elliott Wave Trading
- Rocroy replied Oct 22, 2009
Thanks for the comments. I was more referring to your earlier post where you fibbed waves 1 and 2 for estimating the length of the whole wave. And that same method I have been testing, as you can see in my cable example. The problem I see is that ...
Elliott Wave Trading
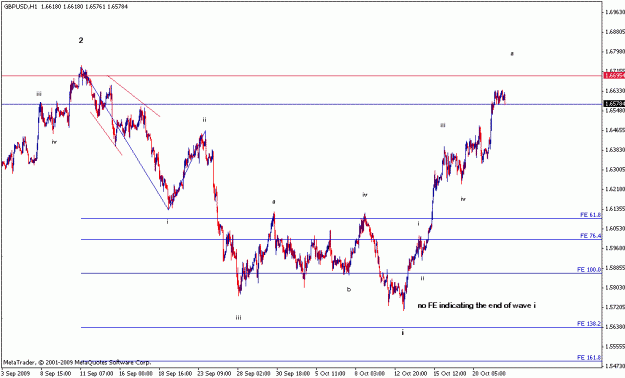
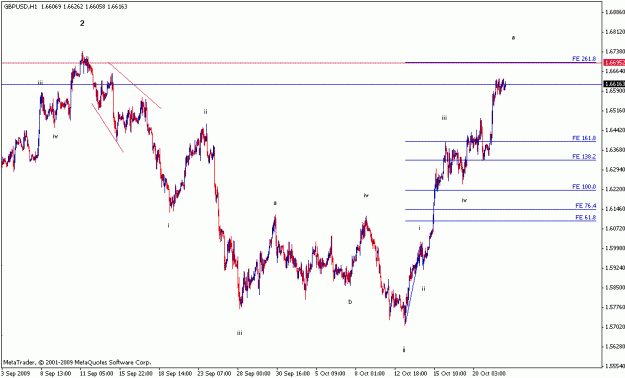
- Rocroy replied Oct 22, 2009
Let's test "the amazing FE" with cable. The measurement says that there is still one wave up left, ending just below prev top at 1.67 My small experience about the tool is that it generally works pretty well, but some exceptions exist, usually with ...
Elliott Wave Trading
- Rocroy replied Oct 15, 2009
well, i have to say i'm a little bit puzzled here...
Elliott Wave Trading it is hard for me to understand what you have actually measured on your chart if i wish to measure wave (1), i place 0.0 line on the bottom of the wave and 100.0 line on top, like this... and ...
- Rocroy replied Oct 11, 2009
well, i think we could start a lengthy discussion about use of probabilities in ew based trading, number of valid counts etc., but probably (heh) without any useful conclusion. so i do not want to go into that. let me just include here an ew chart ...
Elliott Wave Trading
- Rocroy replied Oct 1, 2009
Could you explain "fibo probabilities": what do they mean, how are they generated etc? Thanks, R PS. My 30min chart below. image
Elliott Wave Counting with EG
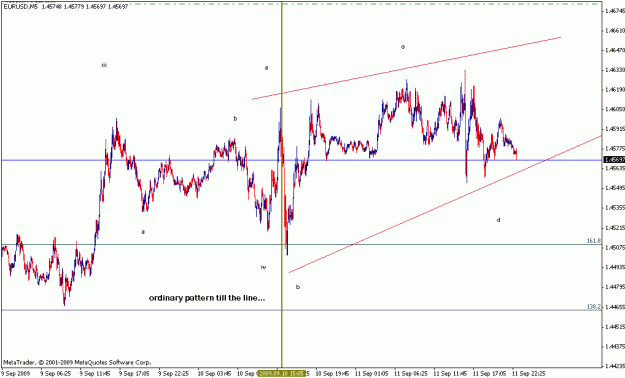
- Rocroy replied Sep 13, 2009
Frankly, the patterns and labeling looks a bit weird... Expanding diagonals do exist sometimes, but this does not look like it to me. Take a look at some earlier diagonals and examples, so you'll notice the difference... Imo w4 is an ordinary a-b-c ...
Elliott Wave Trading