- Search Forex Factory
- 75 Results (2 Threads , 73 Replies )
-
 Mysticdiver replied Sep 15, 2010
Technically, this trade has opened on the 15 mim as well, We broke the TL, the has whipsawed, but still printed H/Hs and H/Ls.
Mystic's "If You Can't Dazzle Them with Brilliance, Then Baffle them with Bullshit"

- Mysticdiver replied Sep 15, 2010
The pair on 5 min chart has hit the 800
Mystic's "If You Can't Dazzle Them with Brilliance, Then Baffle them with Bullshit"

- Mysticdiver replied Sep 14, 2010
Bigandrich, Entry on the "statistical deviation", IE; the pair is statistically oversold ( or overbought ) is based on the traders ability to read price action, support and resistence, I even know some traders who use MACD divergence. I don't trust ...
Mystic's "If You Can't Dazzle Them with Brilliance, Then Baffle them with Bullshit"
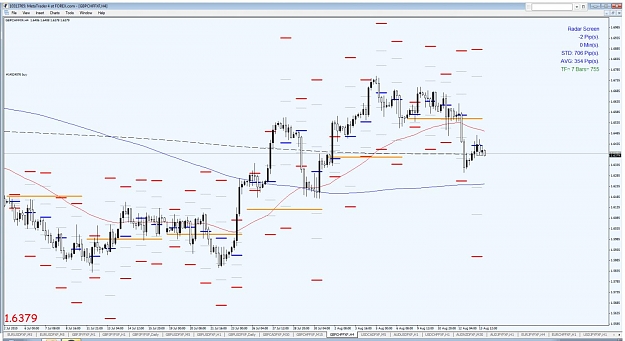
- Mystic's "If You Can't Dazzle Them with Brilliance, Then Baffle them with Bullshit"Started Sep 13, 2010|Interactive Trading|8 replies

Here's what I am watching today: GBP/AUD. I use a system taught to me by Rob Booker. It measures ...
- Mysticdiver replied Sep 1, 2010
Here is what my charts look like with the pivot point EA I use. The light blue lines are the Daily Pivots, the orange lines are the Weekly Pivots. The Red lines are R3 and S3. The points will stay on your charts making it easy to check for "Missed" ...
GU, GJ and EU Analysis Thread
- Mysticdiver replied May 26, 2010
Agree with your targets, probably this week. 13550, then 13676. May not make 13700 immediately.
Auslanco - GBP/JPY and GBP/USD (newstrade)
- Mysticdiver replied Nov 13, 2009
Here is what I am looking at on aud/usd. 15 Min TF. I will short on a close of a nice candle ( no doji's, Morning Stars, Shooting Stars, or Ringo Stars ) below my trend line. TP will be the 800 sma ( dashed black line near bottom of chart). Stop ...
AUD/USD
- Mysticdiver replied Mar 26, 2009
Trading is going so well, I had to hire employees.
Show your workstation!

- Mysticdiver replied Mar 10, 2009
You get tags like this for your car, even though you know 99% of the world won't know what it means. ( my actual tags, I settled for this cause GBP JPY was already taken ).
You Know You've Got It Bad When:

- Mysticdiver replied Mar 4, 2009
I have this nice bullish spike on my chart. In the next couple of hours, I see... eh.... hmmm.... nevermind, wrong chart
Auslanco - GBP/JPY and GBP/USD (newstrade)

- Mysticdiver replied Mar 3, 2009
I knew Lucy very well...and I can back that up with a chart.
Extracted Thread (per thread starter's request)
- Mysticdiver replied Mar 3, 2009
Here is an updated chart (Daily) I posted last week. My ascending TL (support), is now at 13486. I am bullish till we see a close below that. A break above the DT @ 1437, and I am more Bullish
Auslanco - GBP/JPY and GBP/USD (newstrade)
- Mysticdiver replied Mar 2, 2009
Some good friends of mine (traders) see e/u trading around 115xx to 118xx in the not so distant future. And though I respect their opinions, I don't see it happening, ( though anything is possible). I will be posting some charts showing oil/eur/usd ...
EURUSD

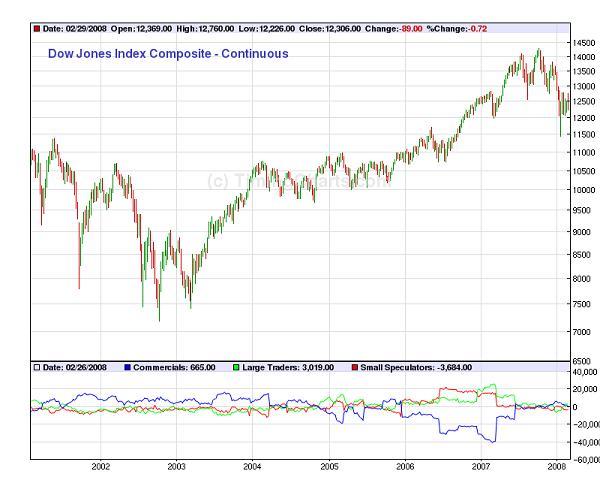
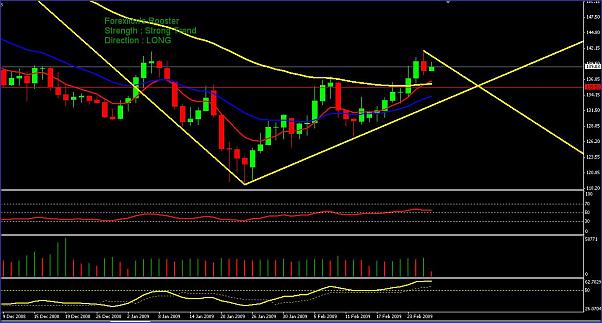
- Mysticdiver replied Feb 27, 2009
A break of resistance @ 1417 will target the 38.2% retracement (on the daily chart from 215xx to 11880) @ 155xx. However, a break of my TL support (daily) currently at 1338x will signal the correction from 11880 is over.
Auslanco - GBP/JPY and GBP/USD (newstrade)
- Mysticdiver replied Feb 26, 2009
yes ( I think). if it fails, could move to ascending TL you have on chart. If it CLOSES below the TL we could see a retest of lows.
Auslanco - GBP/JPY and GBP/USD (newstrade)
- Mysticdiver replied Feb 25, 2009
When the Nickel dropped! — I love trading! When I first started to become profitable, in July, August of 2007, it went to my head. I was trading like a man on fire (great movie BTW). I had 3 consecutive months of +40% gains. Looking back, I ...
Extracted Thread (per thread starter's request)