- Search Forex Factory
- 26 Results
-
 Muntu replied Jan 19, 2014
Hello! Don't know where I am erring here, so please help me as to why the commander box is not showing on my tpo chart. Thanks
Auction Market Theory and Market Profile

- Muntu replied Aug 19, 2013
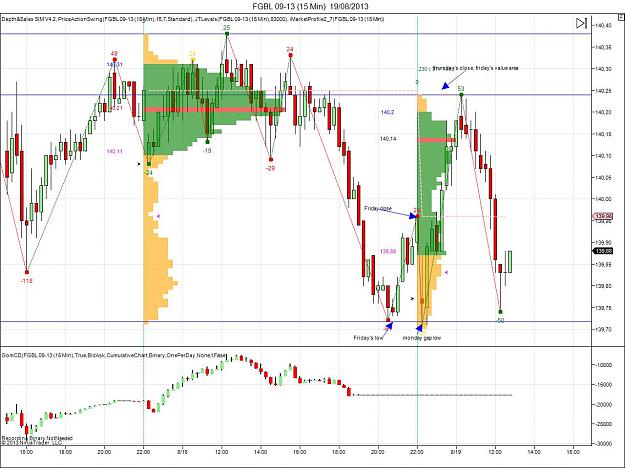
My friend Blott, I am attaching a chart of the present behavior of the bund after a gap at the open this morning. Since a couple of months I am gravitating towards Market profile and Tape reading as my main tools. As you can see, have you gone short ...
Gap Trading
- Muntu replied Feb 24, 2013
My own plan : with the bulls !
XAU/USD & XAG/USD - Gold & Silver Traders Thread
- Muntu replied Jul 20, 2012
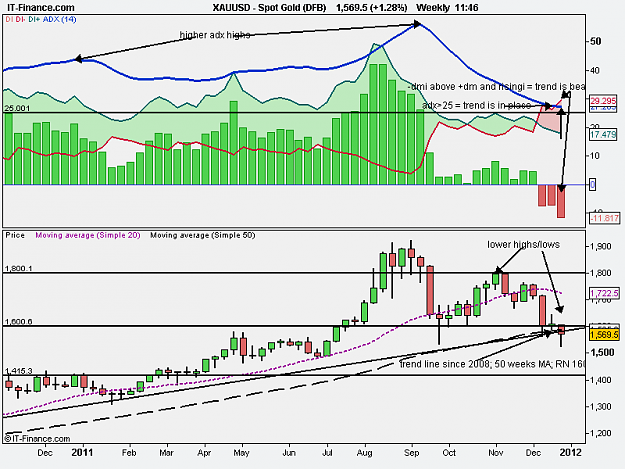
Looks like we are very near but a weekly red candle or a doji around the trend line would be a clearer sign to go short IMHO.
Sugar discussion
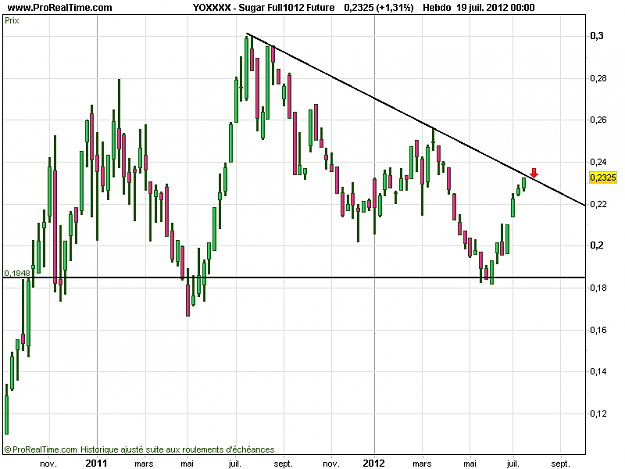
- Muntu replied Mar 15, 2012
Planning to add to my short at 1639. Triangle looks promissing.
XAU/USD & XAG/USD - Gold & Silver Traders Thread
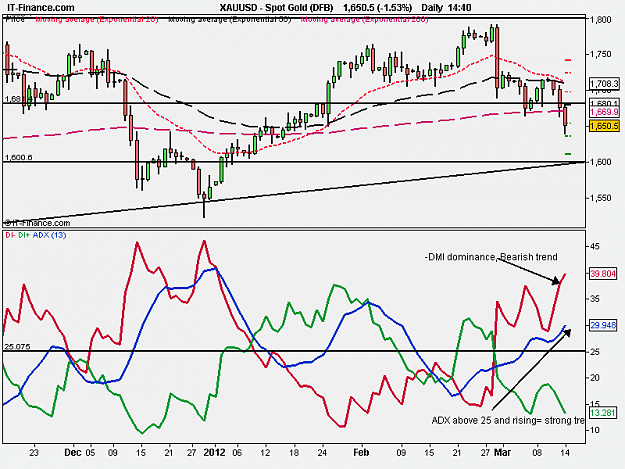
- Muntu replied Mar 14, 2012
Why I am short — From 1665, Now at BE. Yes X, still work ahead for my stops management.
XAU/USD & XAG/USD - Gold & Silver Traders Thread
- Muntu replied Jan 21, 2012
Went long @ 1658 for reasons on the chart attached. Now at BE. Closely watching 1681. Won't add before breach and confirmation at that level. Long A/U as well from 1.0430
XAU/USD & XAG/USD - Gold & Silver Traders Thread
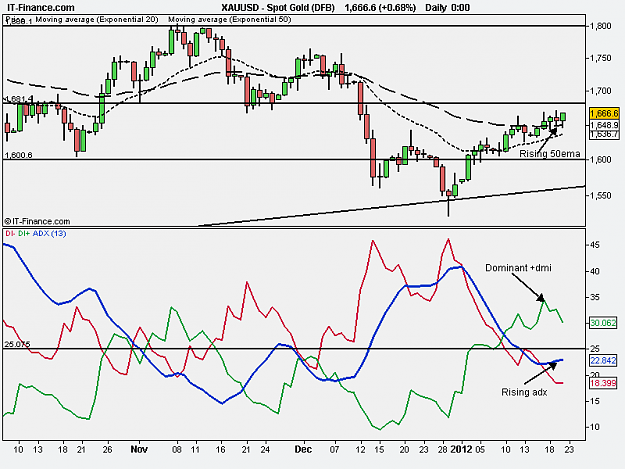
- Muntu replied Jan 21, 2012
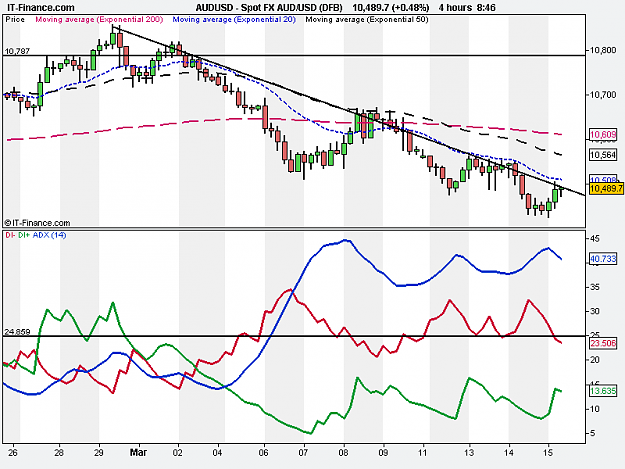
Converging or diverging? — I am afraid we might be talking divergence with completely different parameters. Directional movement system detects divergences just as any other momentum indi. The chart attached shows my own view of the thing and ...
AUD/USD
- Muntu replied Dec 30, 2011
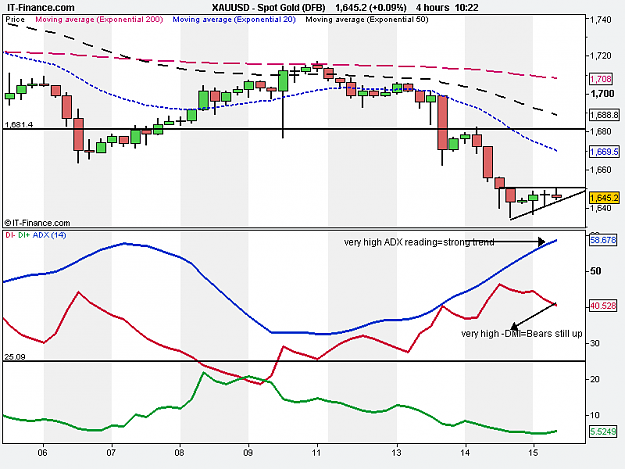
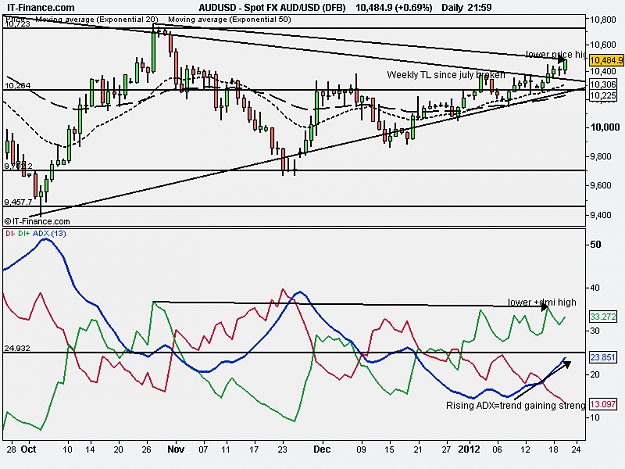
@ Birons I don't know much about Parabolic SAR, but attached chart displays ADX/DMI, from the same Mr Wilder, that agrees with your analysis. Anyway I am at BE with my short 2 days ago and will wait there, either to get out or become really ...
XAU/USD & XAG/USD - Gold & Silver Traders Thread
- Muntu replied Nov 19, 2011
Golden job on here
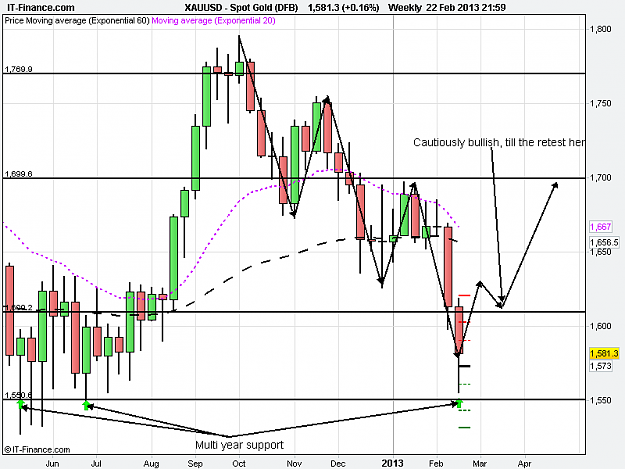
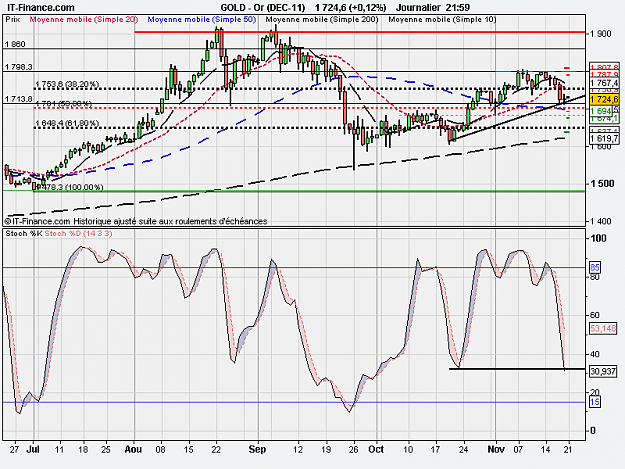
XAU/USD & XAG/USD - Gold & Silver Traders Thread , thank all the contributors. To me it looks like gold will go up because: 1-It found support in an area where there is conjunction of round number 1700 , old resistance become support, 50% fib of last swing up. 2- The ...
- Muntu replied Sep 22, 2011
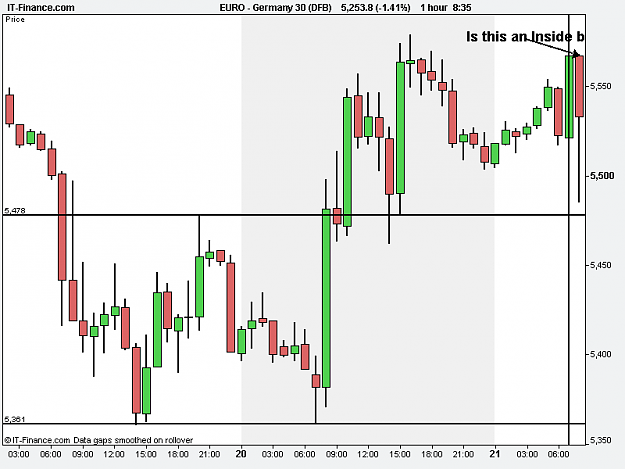
I am wondering if the candle on the chart here attached complies with the DIBS requirements, as the top is not very "inside" and the wick far extends the preceding hour's close, 6.00 GMT 21/09/2011 if I am not mistaken?
The DIBS Method... No Free Lunch continues
- Muntu replied May 21, 2011
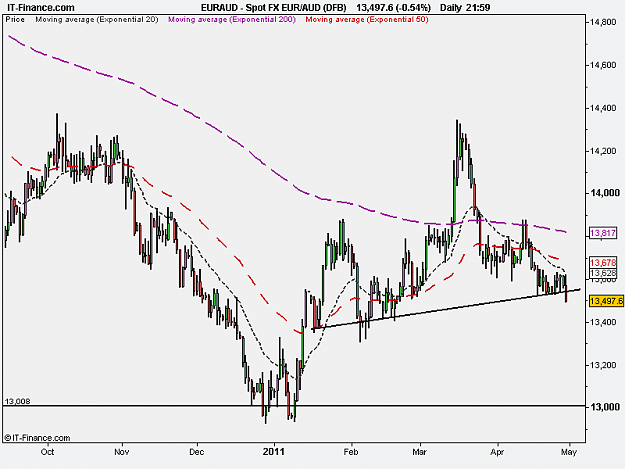
News from the EUR/AUD trade — Good and bad news so far in that trade. The good ones: I am still in it, albeit with the bare minimum, and the trend seems to be resuming. Bad news is I stacked very heavily at some point, then the (bad) news of ...
Building an equity millipede
- Muntu replied May 6, 2011
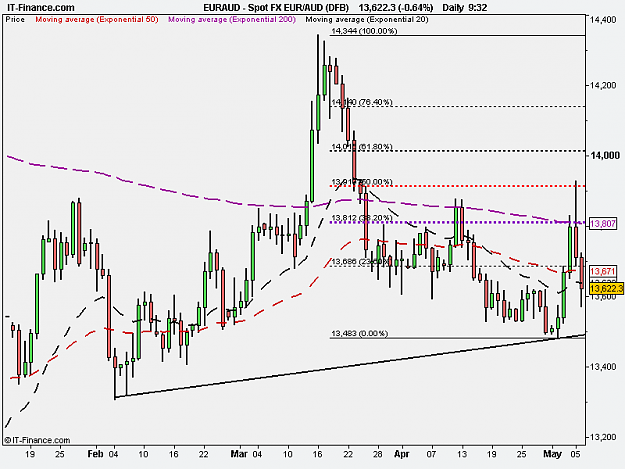
EUR/AUD trade update — After 2 failed probes of 20 pips each, I finally sold the eur/aud pair at market price 1.3744 before going to bed last night, as the European rate release and Mr Trichet's speech had occasioned a pin bar right at the ...
Building an equity millipede
- Muntu replied May 1, 2011
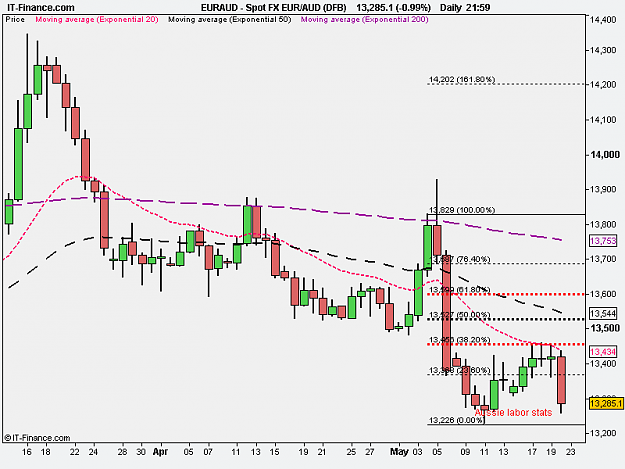
This week's trade: Eur/Aud — Hello, I will be trading the Aussie this week. Monthly and weekly hinsights very bearish. On the daily picture submitted, there seems to be a Head and Shoulders, with the necline just broken. I know a pattern can ...
Building an equity millipede
- Muntu replied Apr 21, 2011
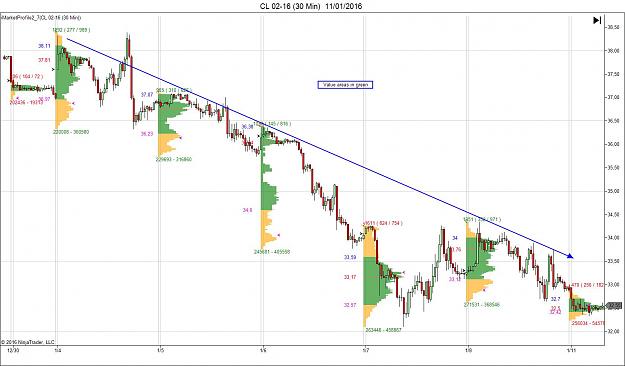
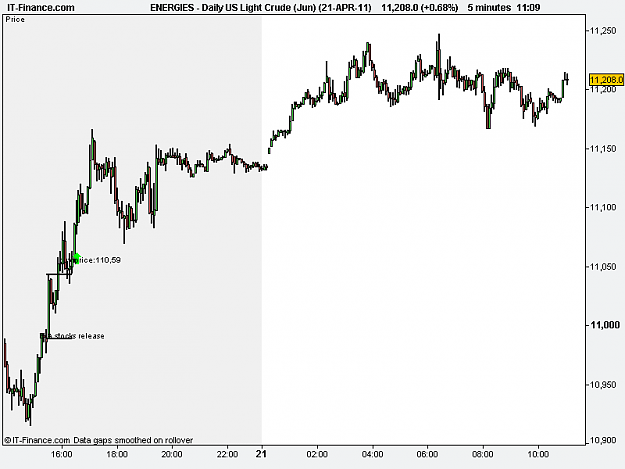
Where do I stack? — Hi Graeme, hi friends! This trade I took yesterday afternoon. My SL is at be+5. So far I have not found the courage to add on another contract, yet the crude oil contract looks quite bullish as of late. can that be what is ...
Building an equity millipede
- Muntu replied Oct 23, 2010
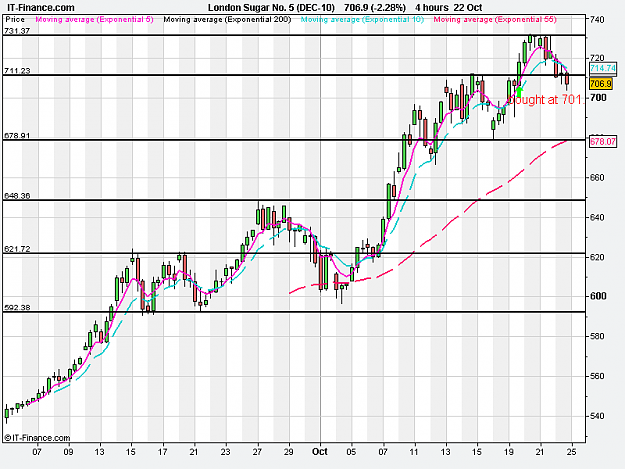
All I need! — As I said last time, all I need is to be able to let my trades run when in profit. Look at this chart. The first time I was long this UK sugar contract cannot even be seen here, as it was around 400+. But I trailed my stop and ...
Building an equity millipede
- Muntu replied Oct 23, 2010
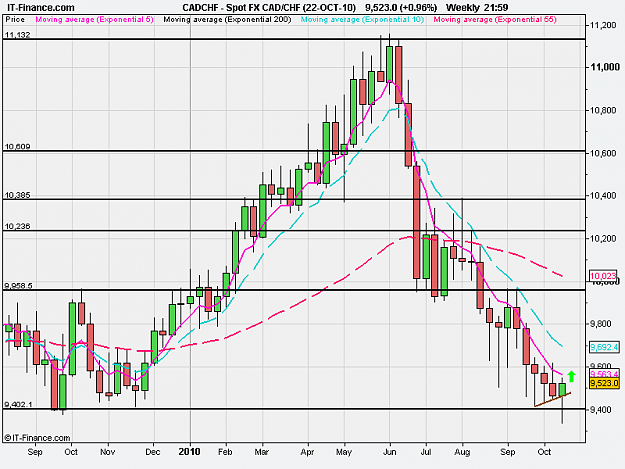
cad chf this week — Do you think this pair is changing direction, with its weekly bullish pin bar? I hope the swissy follows gold in its retracement next week.
Building an equity millipede
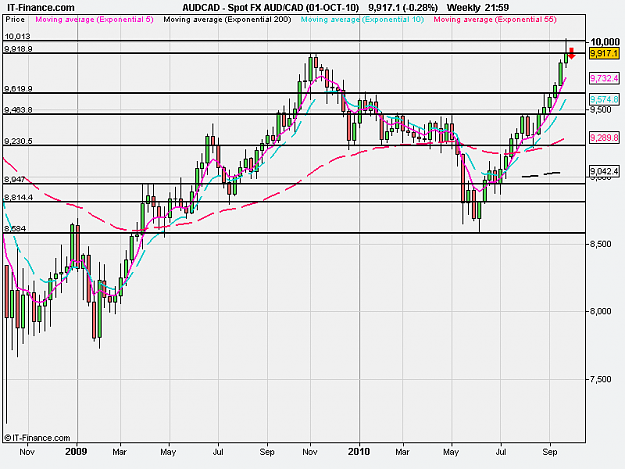
- Muntu replied Oct 2, 2010
My week project — AUD/CAD retrace 50% of its week's bullish candle, after hitting all time high at round number 10000. A mention for the FB. I am definitely short - selling it. Muntu
Building an equity millipede