- Search Forex Factory
- 46 Results
-
 MasterJedi replied Jun 6, 2018
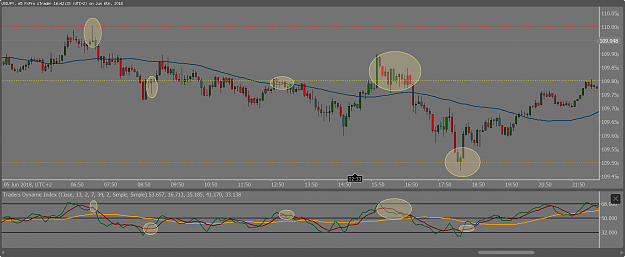
Greetings amigo, 2 months working on a TDI crossover method? Anyway I just added some horizontal lines...can you see the potential? No need for any Turbo Booster XXL Stochastics with fries LOL! image
(binned per thread starter’s request) Lets Improve This Strategy
- MasterJedi replied Dec 13, 2017
Nice, another Dragon thread. Subbed. Which way?? just as Maflip says above. Its been hovering around the D pivot for hours, I expect a nice prolonged move somewhere, somehow...
Dragon or Snake - GU, UJ, GJ, EU, EJ
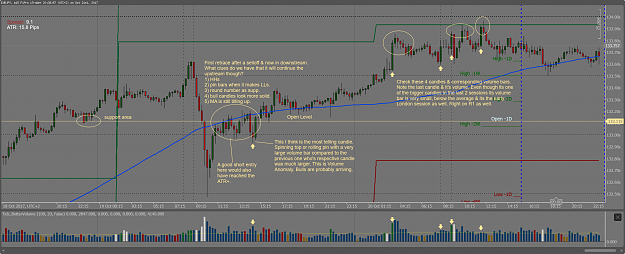
- MasterJedi replied Dec 13, 2017
Greeting traders. Glad to have found a thread dedicated to volume analysis. I don’t trade this technique yet but since I started last year volume is something I always have another look at it. Up until now the best I’ve come up with is ...
vsa with Malcolm
- MasterJedi replied Oct 20, 2017
Best always trade with the so called trend or I prefer to call it the stream (upstream & downstream) because the trend is actually something else. An uptrend is when price makes HHs & HLs. Big difference between a trend & the overall 'sentiment'. So ...
Jedi Space Lounge

- MasterJedi replied Jun 20, 2017
Hope your doing ok Connors. That was a beautiful poem you wrote earlier...maybe it's time to replace her with another; image
EURUSD

- MasterJedi replied Jun 19, 2017
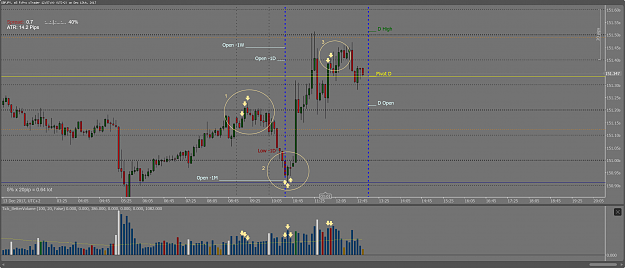
I think that should be enough...time to share the peace pipe now; image
EURUSD

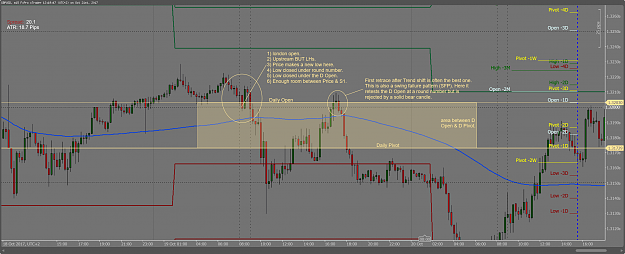
- MasterJedi replied Jun 19, 2017
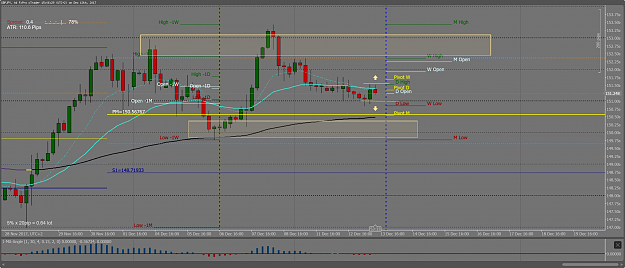
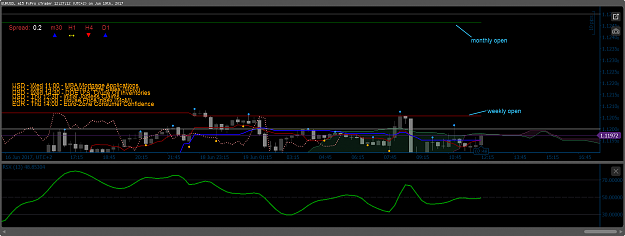
We now have a weekly & monthly open to keep us in check
EURUSD image
image
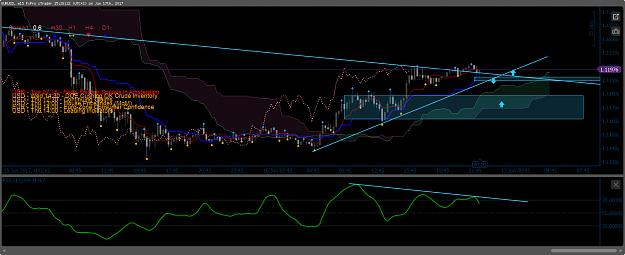
- MasterJedi replied Jun 17, 2017
Here is my take with a chart. I expect a correction at least & then possibly longs from lower rectangle area. However if price treats the top trend line as support then a much earlier long might be required. Hope y'all are having a fine start to the ...
EURUSD
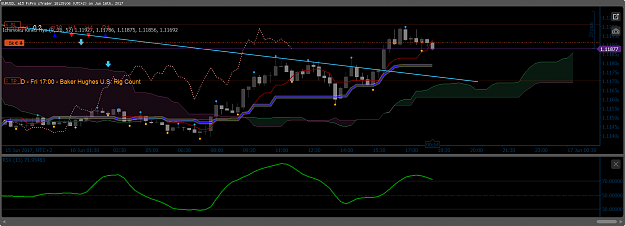
- MasterJedi replied Jun 16, 2017
took a short earlier target 21pips...then went long with uj also. image
EURUSD

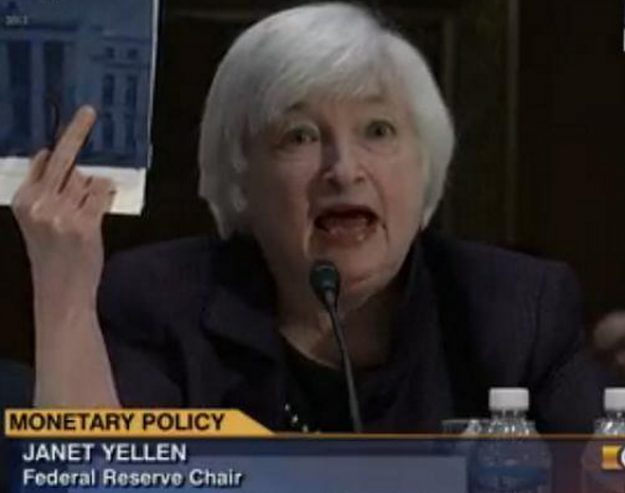
- MasterJedi replied Jun 15, 2017
Janet say's; Here's what I think about your fekkin multi-time frame technical price action analysis shit! image
EURUSD
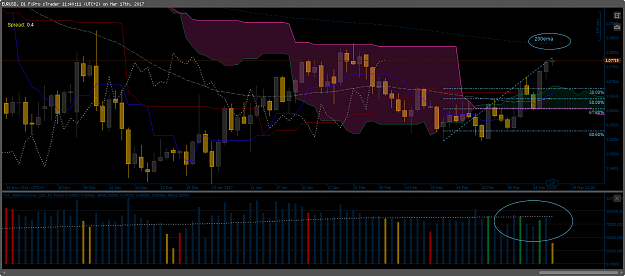
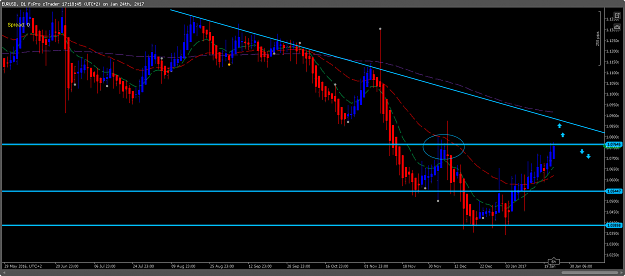
- MasterJedi replied Mar 17, 2017
Hello everyone, for what it's worth on the daily chart price is very near the 200ema. Actually 1.82 hits the 200ma so probably still room for north. It looks like it's going to be hard to drop this pair so a further move upwards is logical...reach ...
EURUSD
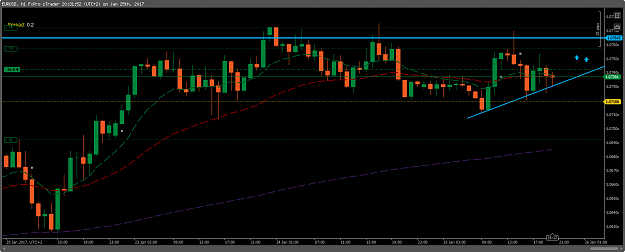
- MasterJedi replied Jan 25, 2017
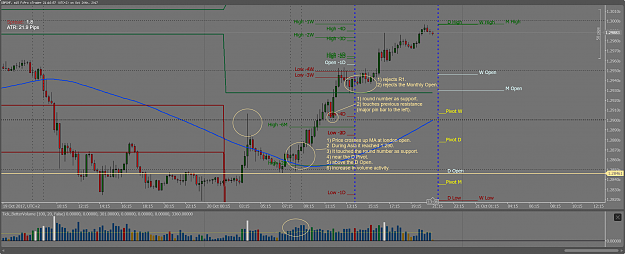
Hi Greg, I'll try to explain why I was interested in this chart. Every time price reaches a key level (daily+) it should be of interest. The chart below is 4hr, the vertical line is where I spotted this yesterday. The question is which way is it ...
The Spartan Trader FX System

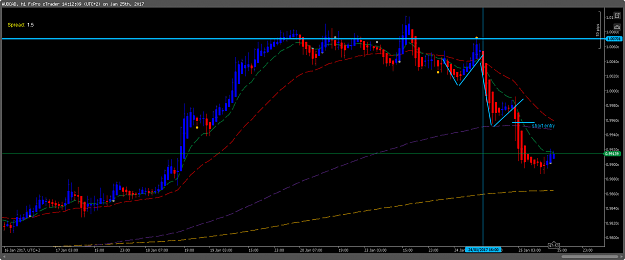
- MasterJedi replied Jan 24, 2017
Targets were both hit on au so I thinks that's me for the day. Although this eu pair looks bullish it's arrived at a key level & may well decide to range so a move back to 1.06 is possible. image
EURUSD
- MasterJedi replied Jan 24, 2017
I was looking at aus/cad for a short. image
The Spartan Trader FX System

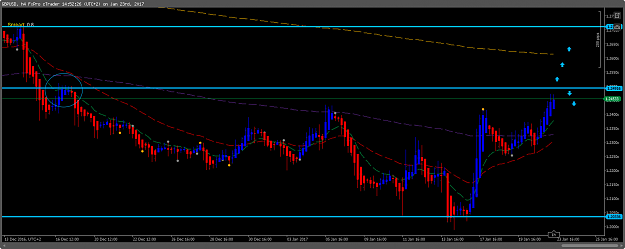
- MasterJedi replied Jan 23, 2017
Seems like price is reaching a key level. Will see how it reacts at 1.25. image
Cable Update (GBPUSD)
- MasterJedi replied Jan 20, 2017
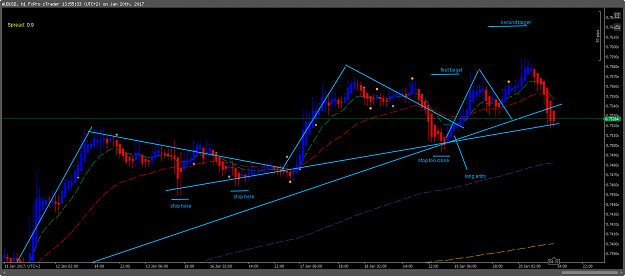
Hi greg, I don't know if I have a tactic for this but I do try to avoid placing them in obvious areas of demand/supply especially if its swing trading where the targets are quite far. You mention stops behind most recent swing, but better behind the ...
The Spartan Trader FX System