- Search Forex Factory
- 76 Results
-
 Lou replied Mar 27, 2024
Nothing much happening with these pairs for quite awhile.
Trading TheStrat / Rob Smith's Method Oh, please excuse the duplication .. that is how it downloaded image
- Lou replied Mar 2, 2024
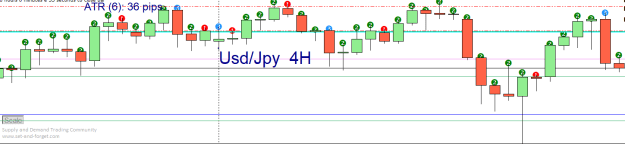
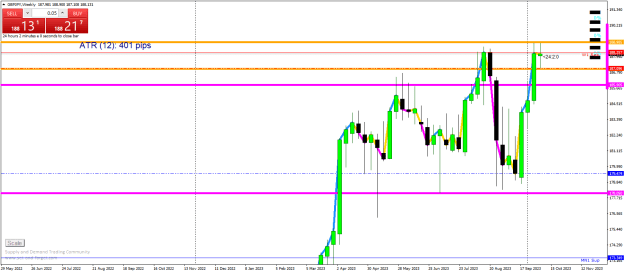
One adjustment I made was to find the pairs that had the largest pip ranges per TF and focused on those. Use the MT4 indicator ATR in Pips.. shows the ATR period and pip range on screen in text . As far as finding the R:R you want, that is up to the ...
Trading TheStrat / Rob Smith's Method
- Lou replied Feb 12, 2024
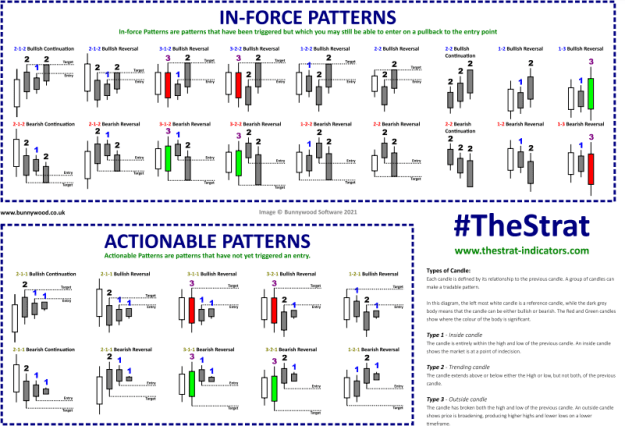
Here is the Guide Sheet I mentioned above.
Trading TheStrat / Rob Smith's Method When I went back to the link I noticed all the items there that are for sale. Skipping those. This was free and shows Actionable patterns.
- Lou replied Feb 11, 2024
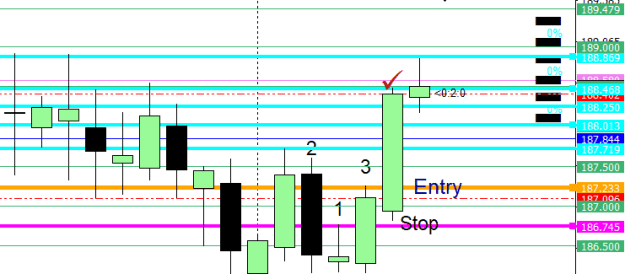
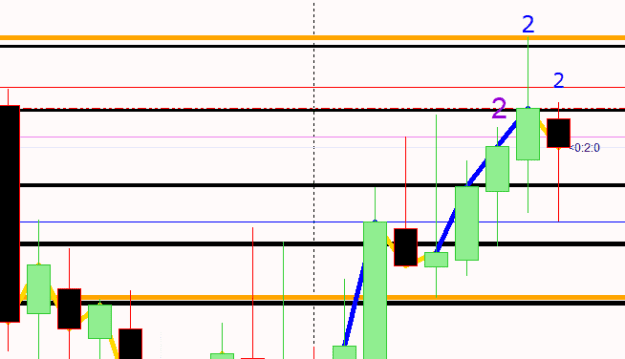
GJ process on the DAILY from a few days ago. This chart assumes that the Monthly and Weekly have been identified showing up moves ..for Full Time Frame Continuity 2 1 3 pattern has formed in three Daily bars. The following candle with the check mark ...
Trading TheStrat / Rob Smith's Method
- Lou replied Jan 27, 2024
Here is the Weekly Candle chart for G/J for comparison
Strat's PASR Long Term, Stress Free Trading image Now to trade or not to trade the weekly doji. Maybe watch and see on Monday/Tuesday .
- Lou replied Jan 27, 2024
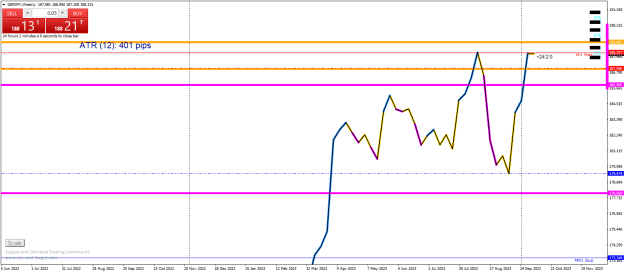
Nice comparison showing Higher Time Frame Continuity. And Line vs Candles. Regarding the Line charts, which I like to use... Got this indicator MA in Color from Strat's old thread, seems like a hundred years ago... Anyway I like the way it looks and ...
Strat's PASR Long Term, Stress Free Trading
- Lou replied Jan 24, 2024
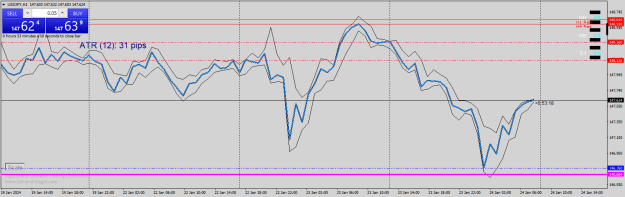
I thought someone might find this useful. The chart posted combines the line chart which tracks only closing price , with the H and L of price as if it was a candlestick or bar chart. Blue Line = closing price. aka a Line Chart Black lines = the ...
No Indicator Trading System

- Lou replied Jan 14, 2024
Looking at Eu/Au Daily. Black lines are BRnumbers 00 /50, I am highly aware of FX manipulations with BRN Buy at Red line . TP at upper Orange line which is last Month's H. Will watch at BRN which is 1.6450 SL at current price . I know this is a poor ...
Terry's Journal

- Lou replied Jul 8, 2023
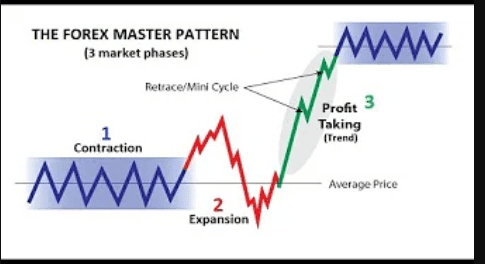
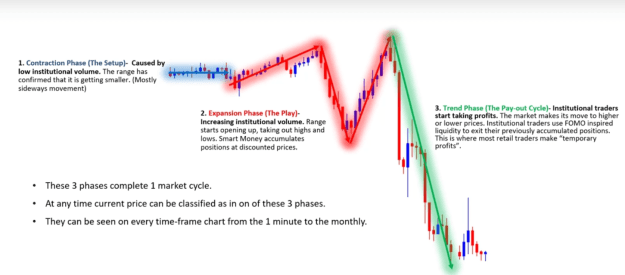
Here is a screen shot of their thesis image
Volman meets Burke or My journey with PA


- Lou replied May 13, 2023
Here is an example from the AJ 4h chart that IntheBox posted # 531
SRTLfd Discussion
- Lou replied May 8, 2023
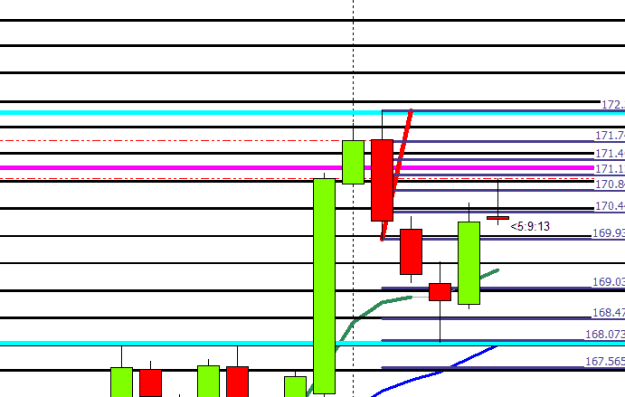
An additional 'signal' : The red candle following the small blue one together form the Double High Lower Close pattern. Stretching a fib from top zero to 100 bottom of the red candle gives a 178 target which price hit exactly two days later.
SRTLfd Discussion
- Lou replied May 7, 2023
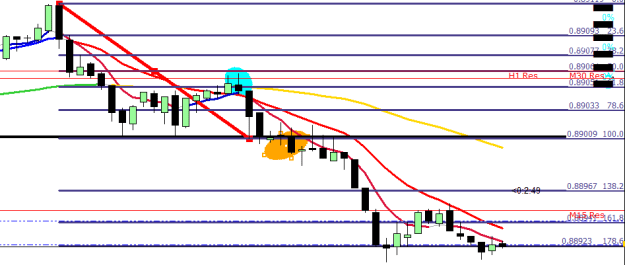
UCHF 5m Red diagonal from Asia Session May 8 open to bar count 18 (coinciding with RN 0.8900.) Blue oval is price retracing to 50 line . Orange is breakout bar from the box. You can see desired TP 178 has been hit. Question .. In the future should I ...
Flying Dutchman
- Lou replied May 6, 2023
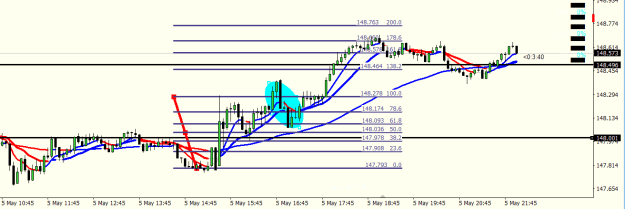
Just thought I would share recent use of the 50 line on the EJ on May 5. Took the trade after the 5m break of the Box. In the past I would have closed the trade at such a fast and strong reversal . This time I had decided to make use of the 50 as a ...
Flying Dutchman
- Lou replied Mar 26, 2023
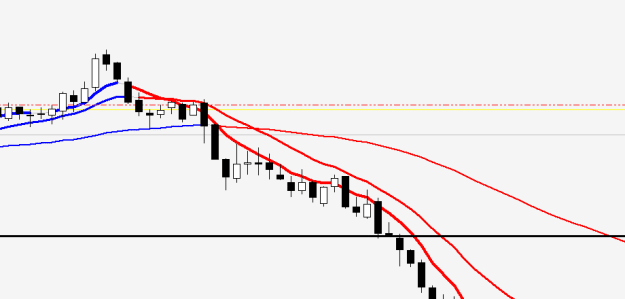
SPZD I decided to put it up GJ the idicator is called MA in Color . my settings 9, 20 and 72 linear weighted moving average. I still like the Price Slice where a single bar cuts through at lest two of the MA's which have changed color.
Volman meets Burke or My journey with PA
- Lou replied Jan 9, 2023
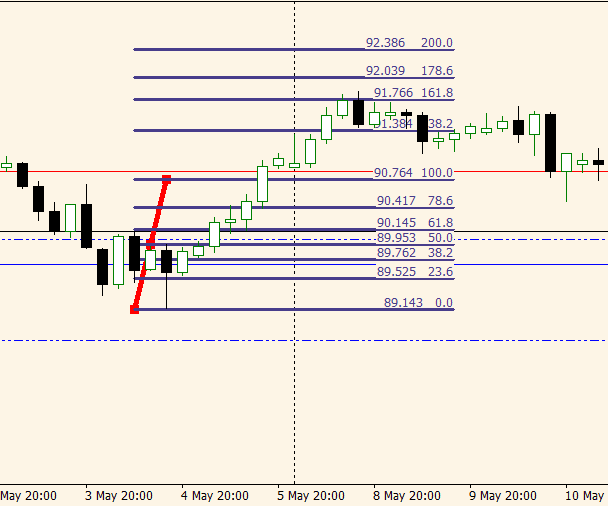
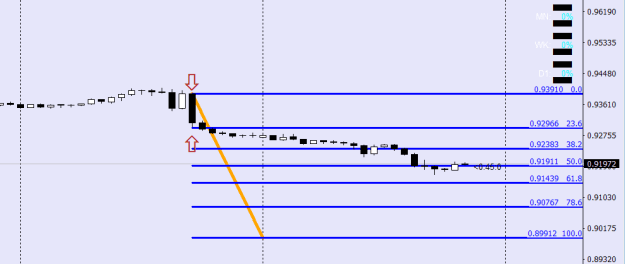
Here is a way to use the Fib Tool for direct projection off of a candle set up such as .... engulfing, double high lower close, double low higher close and others you favor . This is 1hr Usd/Chf Draw the fib tool starting with the O value at one end ...
Volman meets Burke or My journey with PA
- Lou replied Nov 6, 2022
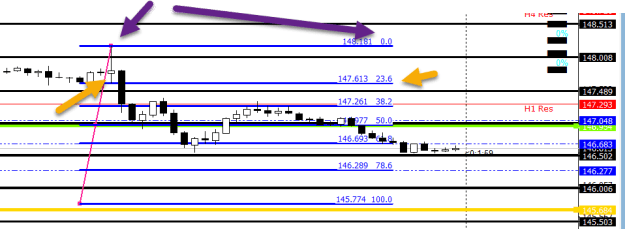
This 'different' application of the Fib tool can be helpful in anticipating TP targets... especially when it lines up with earlier levels and/or round numbers. This is U/J 15m . Notice the Fib is drawn differently than we may be used to. Blue arrows ...
Volman meets Burke or My journey with PA
- Lou replied Oct 20, 2022
Late night musings after reading the last thread pages.. thanks for the information. Basic candle patterns is what I look for as well. Like the circled patterns on your chart example. Also like Double High Lower Close... the reverse of that. ...
Volman meets Burke or My journey with PA
- Lou replied Oct 15, 2022
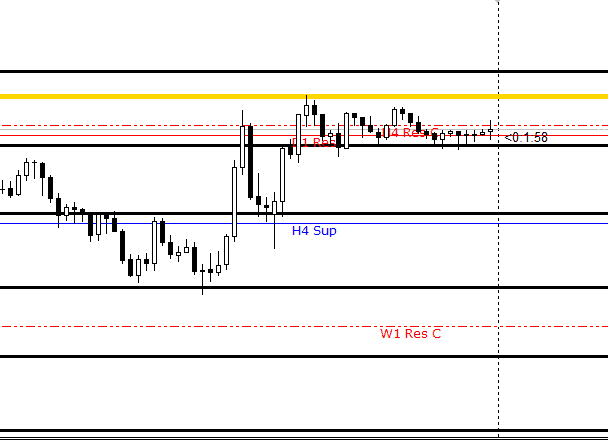
Does SB give any meaning to this pattern going forward ? E/J Friday's close. What if it was a mid week close ? Yellow line is the H of this Week so price is at the H of the W. Last time price was at this level was a month ago. Upper black line is 00 ...
Volman meets Burke or My journey with PA
- Lou replied Oct 13, 2022
Well this was a screw up day... Missed nearly all of the UCad trade... which is my focus lately .... And I was not focused.. also could not recall SB info for trading after the news.
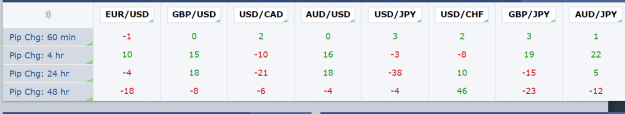
Volman meets Burke or My journey with PA And this did not help either..... The Market feature on ...