- Search Forex Factory
- 233 Results
-
 Dr.Phoenix replied Jun 18, 2020
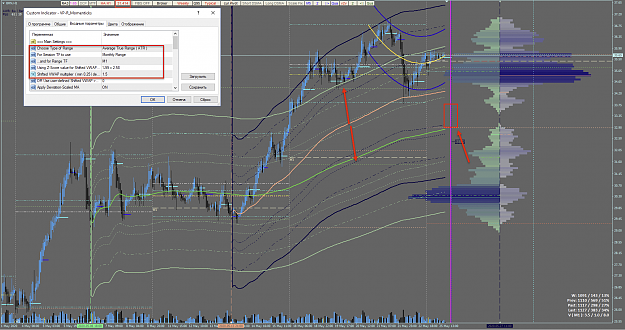
Much more interesting found source - url Another thought to have just enlighted me is to make the different Z-score settings for those two VP-R_Momentics VWAP profiles (as you made two buttons were for ATR and AR). The different ranges need the ...
v2v dynamic trading system
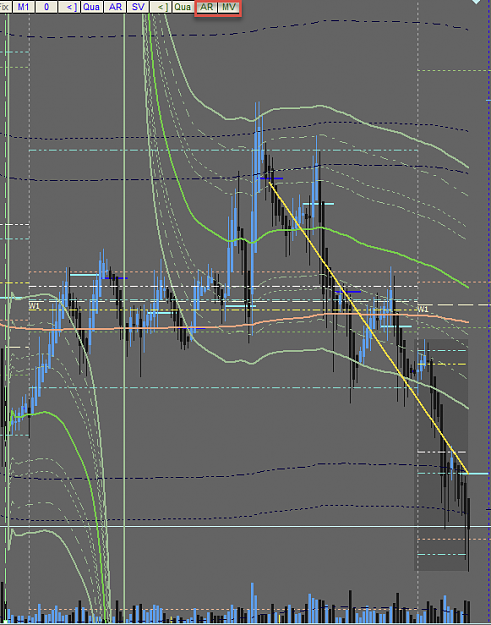
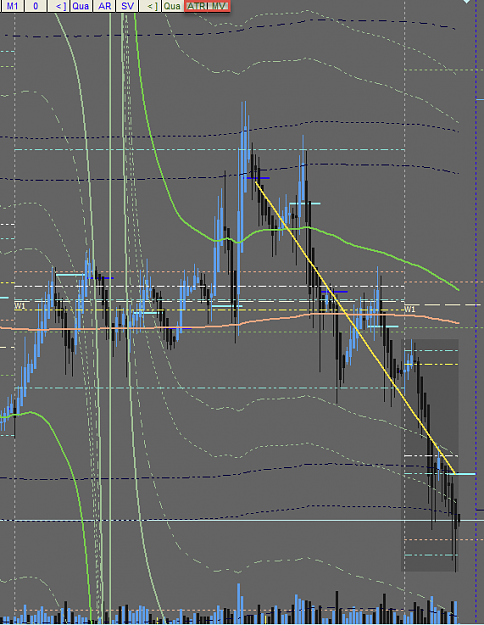
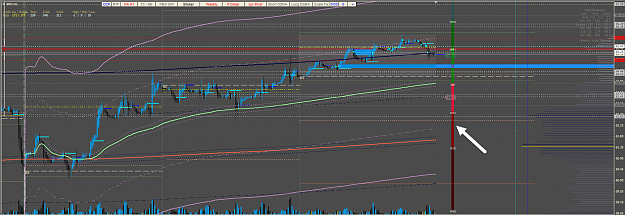
- Dr.Phoenix replied Jun 15, 2020
Many Great Achievements But AG/USD looks beautiful ))) Reactions to the buttons marked. Best D.P.
v2v dynamic trading system
- Dr.Phoenix replied Jun 12, 2020
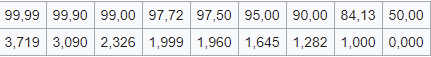
Hi, v2vboni Would you please to add Qua for Q99, Q99,9 and Q99,99 to look at the more appropriate case, matching the price? Best D.P.
v2v dynamic trading system
- Dr.Phoenix replied May 26, 2020
A suggestion to your issue list ) 1. to add Z-score to the RSI legacy indicator 2. RA1/RA2/RA3/ and OFF Best D.P. 1/ Neural net is stalled since yesterday. Please take a notice 2/ VHF at RSI. What is it? Almost no reaction when pressed. P.S. Great ...
v2v dynamic trading system
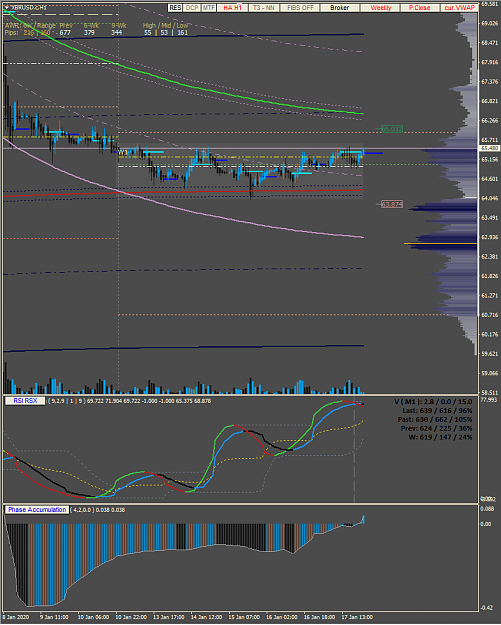
- Dr.Phoenix replied May 25, 2020
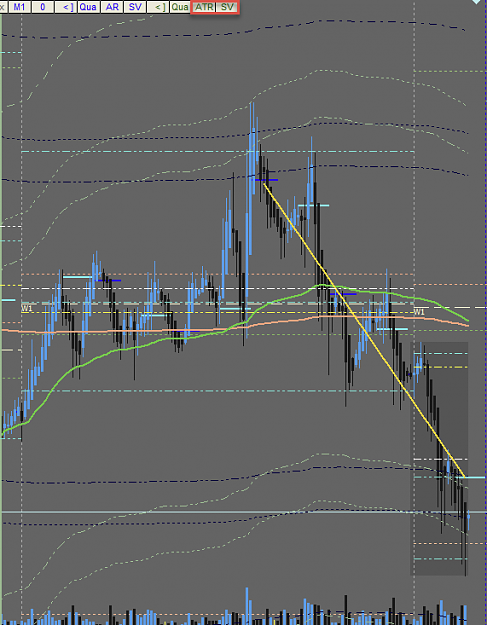
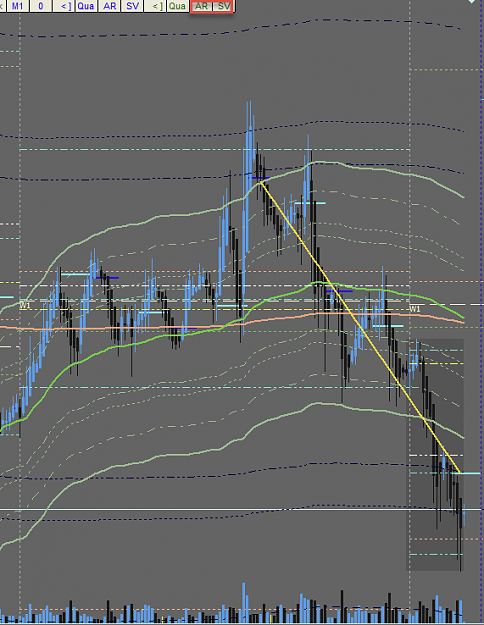
Hi, v2vbony I am using the system on Brent (Brn) Oil (the picture is attached). So, I seem to find some issues to check. 1/ The neural net is magenta; it seems to be malfunctioning. 2/ I have found that ATR parameters completely depend on Z-score ...
v2v dynamic trading system
- Dr.Phoenix replied May 15, 2020
Hi, v2vboni I have got an option into your wait list. At the picture you can see the ancor of the VWAP and the delimiter of a week. The idea is to automize the ancor switching into a new position each time a week ends. The new position of the ancor ...
v2v dynamic trading system
- Dr.Phoenix replied Apr 19, 2020
ouch! Dear, v2vboni, may I expect the system being transferred to MT5? Best D.P. P.S. I have some tools to suggest to be integrated into the system, but I'd rather to suggest them after MT5 integration? P.P.S. Added some time later. What if these ...
v2v dynamic trading system
- Dr.Phoenix replied Apr 2, 2020
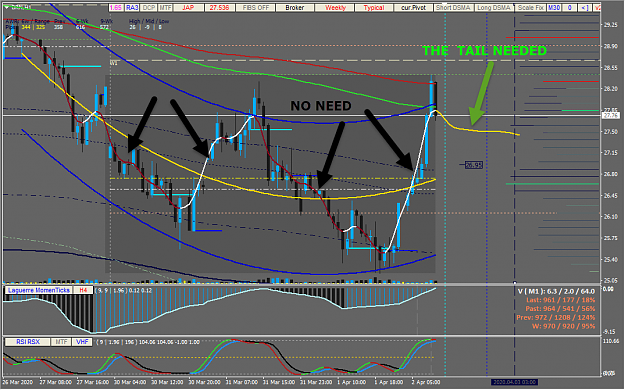
Hi, v2vboni A thought: Can you make a trigger to switch off these neural net MAs, excepting the yellow tail? Best D.P.
v2v dynamic trading system
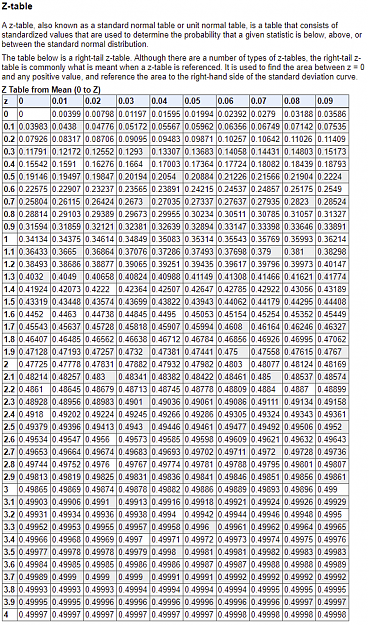
- Dr.Phoenix replied Mar 30, 2020
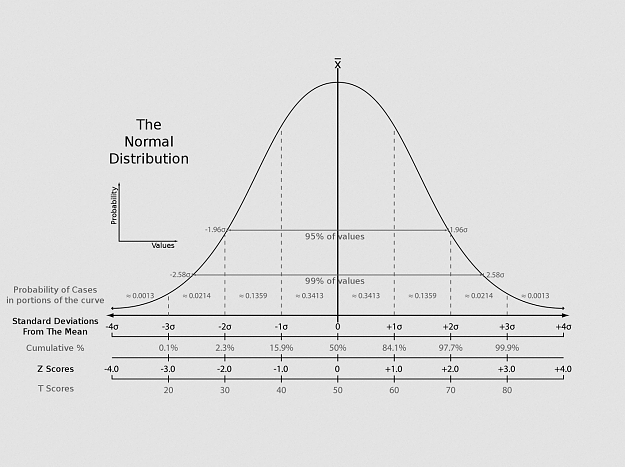
Standart Deviation and Z-score Dependance
v2v dynamic trading system
- Dr.Phoenix replied Mar 16, 2020
Why is it so to be in the last .zip? Best D.P.
v2v dynamic trading system
- Dr.Phoenix replied Jan 19, 2020
V2vboni, I meant as follows - yes, the button will remain, but its position on the screen should be shifted to the position of RSI button (left), if possible. Look at the picture below. You can not see the MTF button, if the chart is one half (or ...
v2v dynamic trading system
- Dr.Phoenix replied Jan 11, 2020
V2vbony, I have seen your discussion with DonPato at his thread and must say you were discussing about the same things but different manners. I thought what if, using the J.Perl concept (see at the picture below), some kind of signals might be ...
v2v dynamic trading system

- Dr.Phoenix replied Dec 22, 2019
I think, V2vboni, your brain can now extrapolate things I am trying to show you each time when contacting )) Best D.P. P.S. A picture is for better thinking... if you like ))) ...or something like this. Indicator is behind
v2v dynamic trading system
- Dr.Phoenix replied Dec 14, 2019
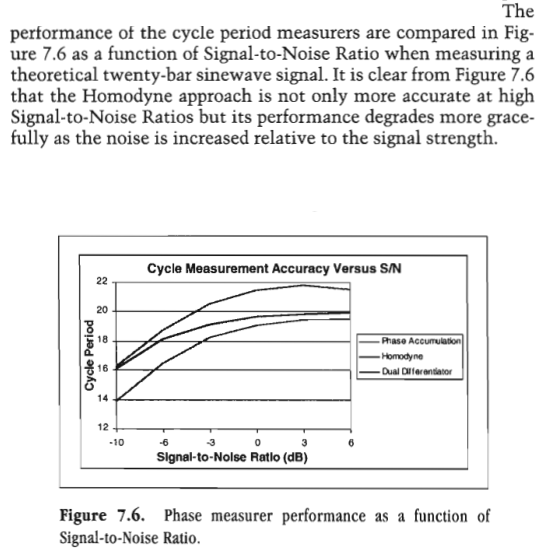
Hi, V2v, Reading the above book, I just confronted with some kind of approach - here it is below at the chart. However, this apporach is a theoretical one. The question - is the 20 bar approximation enough? I mean, is there any difference between ...
v2v dynamic trading system
- Dr.Phoenix replied Oct 20, 2019
Thinking of it.... Or... even earlier. Best D.P.
WTI Crude Oil Trading
- Dr.Phoenix replied May 23, 2019
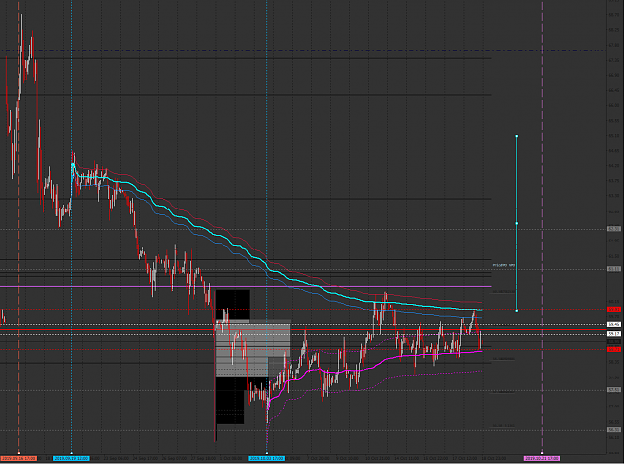
Hi, v2vboni I have just tried to use the VWAP at the Brent H1 chart. Look at it below. Why does this ATR Monthly not fit the price volatility? Try youself. Best D.P.
v2v dynamic trading system
- Dr.Phoenix replied Apr 11, 2019
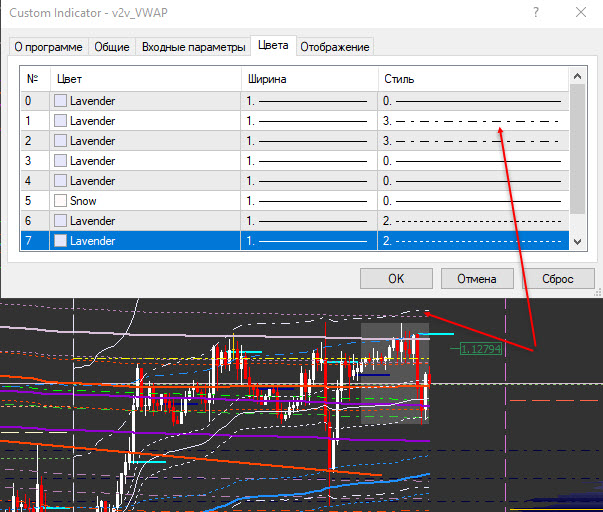
I meant these lines. I have tries to change their stile and color and nothing happened unfortunately. Best D.P.
v2v dynamic trading system
- Dr.Phoenix replied Apr 8, 2019
THE HIGHER TIMEFRAME SYSTEM USAGE EXPLAINED Best D.P.
v2v dynamic trading system
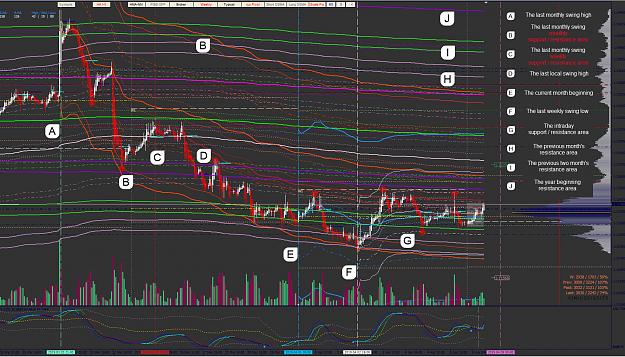
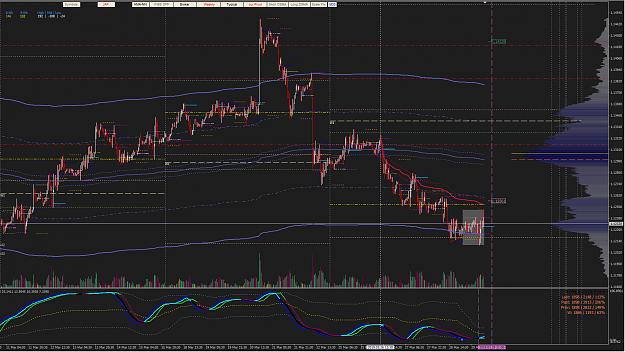
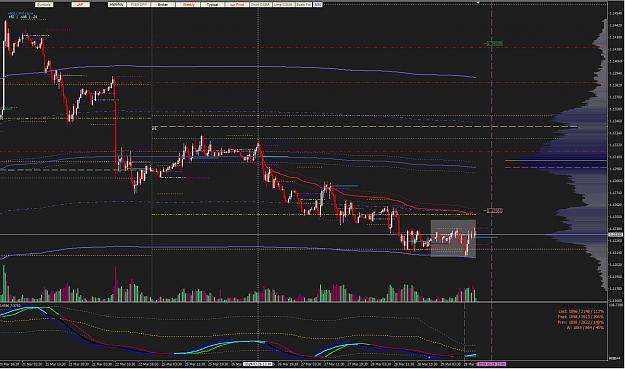
- Dr.Phoenix replied Mar 29, 2019
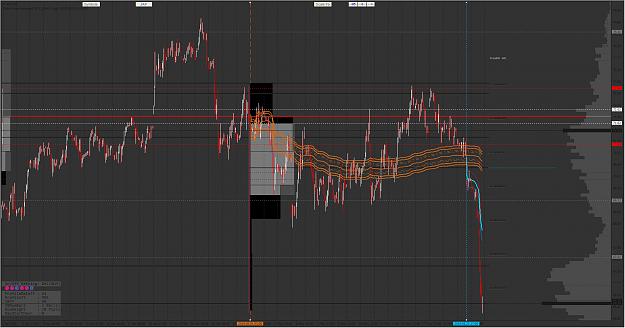
The usage of the system at the picture you can see the VWAP at ATR of 36 period of D1 (the upper picture) ancored at the beginning of the current month; and the right part of the above picture (the lower one) - the usage of the VWAP at ATR MONTHLY. ...
v2v dynamic trading system
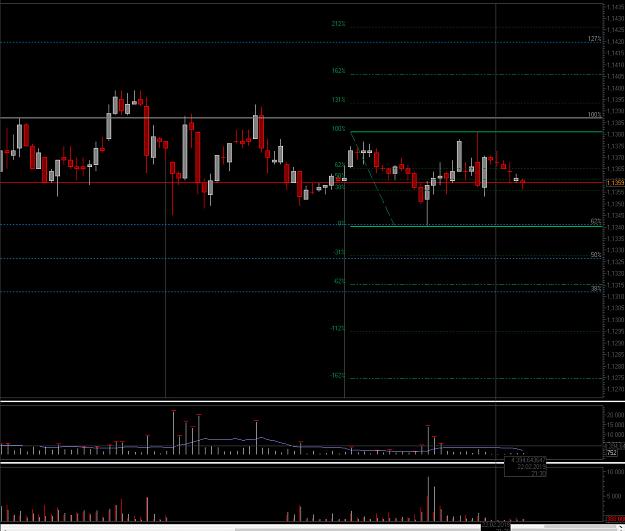
- Dr.Phoenix replied Feb 24, 2019
Thank you very much, Kette. I have found some at my side. I now use the EURUSD futures real volume data. However I must thank you for your kind publication of these indicators. At the picture you can see the ED 3.19 future chart. Volumes are below. ...
Auction Market Theory and Market Profile