- Search Forex Factory
- 130 Results (1 Thread , 129 Replies )
-
 BeachBum replied Jul 28, 2009
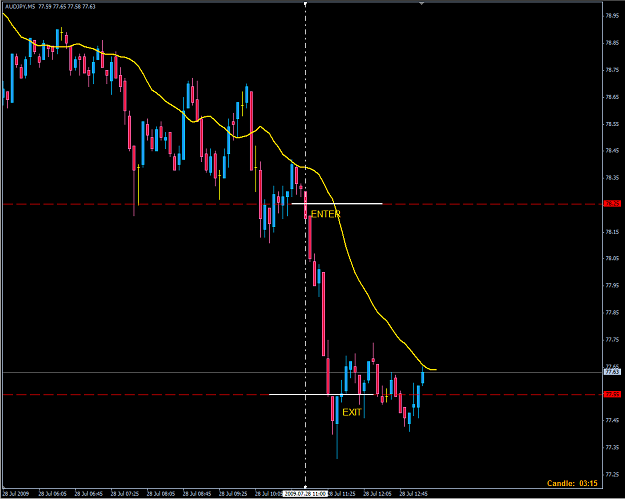
Like the AUD/JPY? — Take a nap from 4 AM, have breakfast, trade this pair again from 11 AM. Get the picture?
MAX Trading System
- BeachBum replied Jul 28, 2009
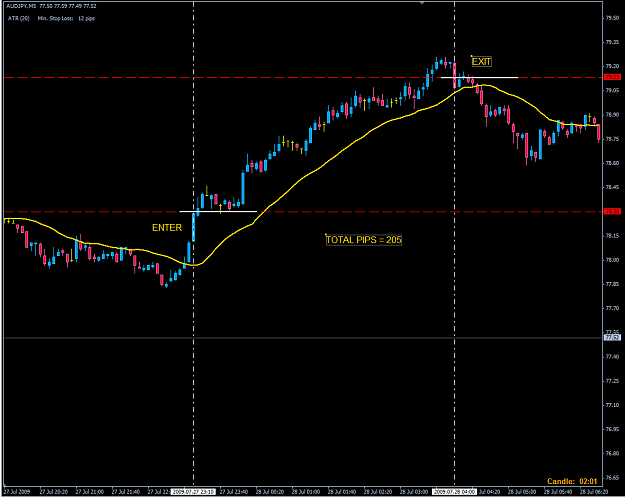
This one's for you opie..... — Last night (EDT) M5 on the AUD/JPY 11:10 PM to 4:00 AM 4 hours Total possible 205 pips I say "possible" because I did not trade this session last night; but if I had, this would have my trade for the night.
MAX Trading System
- BeachBum replied Jul 28, 2009
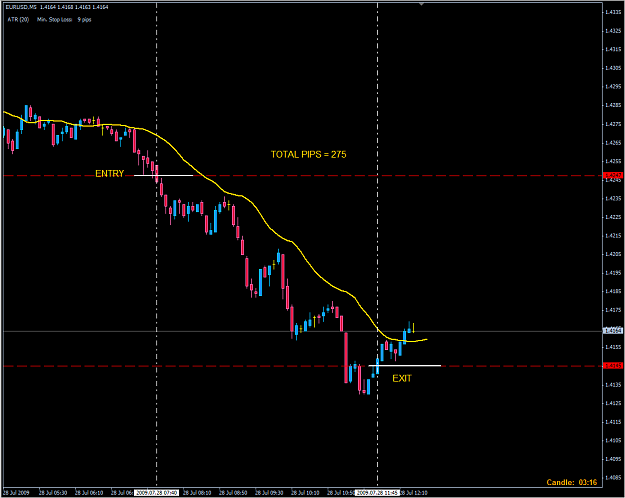
Tuesday July 28 MAX Trade — Here is the MAX Trade I took this morning on the EUR/USD: M5 chart Beginning at 7:40 Eastern Time 4 hour trade Total pips gathered = 275 This is how MAX Traders do it everyday!
MAX Trading System

- BeachBum replied May 17, 2009
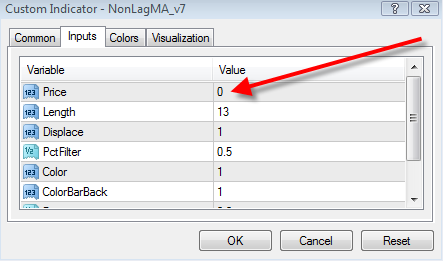
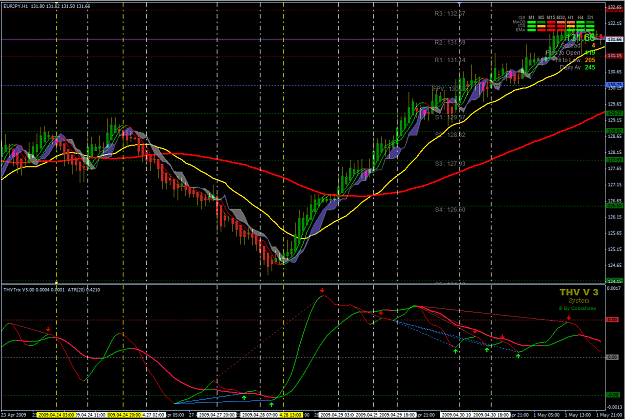
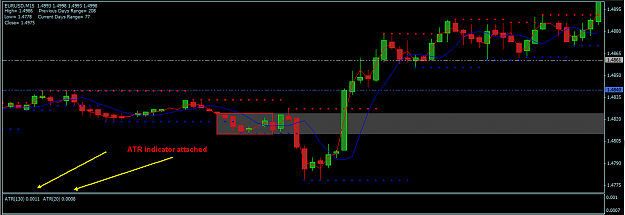
Higher TF technique... — For those who like to trade M15 and higher; here is a little technique I have been using for a while that helps maximize trades by keeping DD low, avoiding range areas, providing optimal entry points and maximizing pip ...
THV system, final edition
- BeachBum replied May 4, 2009
All in a day's work... — Two trades.....200 + pips.....all on the M15 Thank you Cobra and your illustrious team !!!
THV system, final edition
- BeachBum replied May 3, 2009
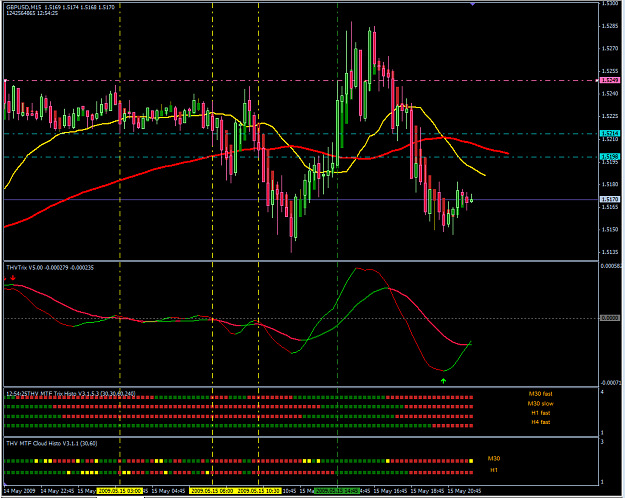
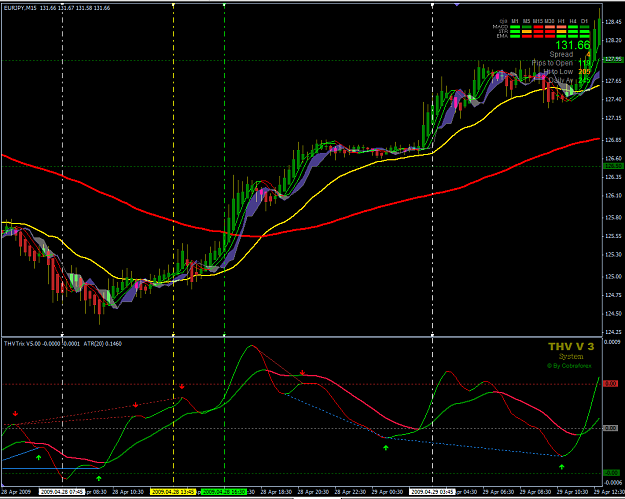
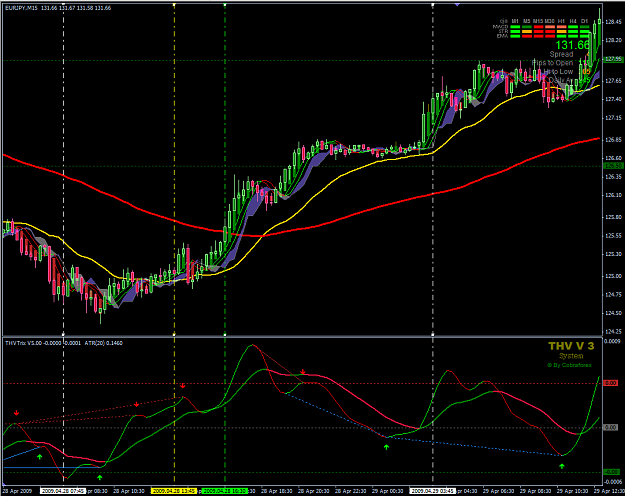
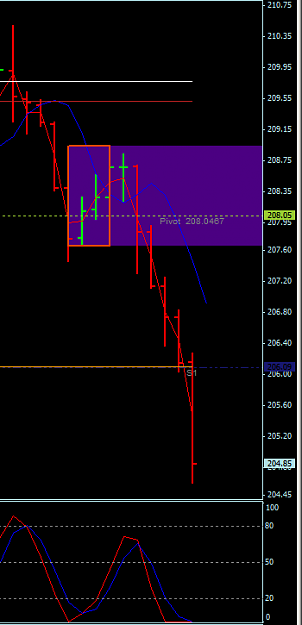
The M15 combo... — In chart #4 I have added the MTF Trix Histo as per SpecialEd's setup with these setttings: M30Fast, M30Slow, M60Fast, M60Slow. Four aqua lines are placed where the M60Fast changes color. Remember this was the first signal we ...
THV system, final edition
- BeachBum replied May 3, 2009
M15 chart analysis... — Chart #2 we have gone to the M15 and I have advanced the vertical lines to show the correct timing based on the close of the appropriate H1 candle. The white lines show good entry signals. The yellow is dangerous ...
THV system, final edition
- BeachBum replied May 3, 2009
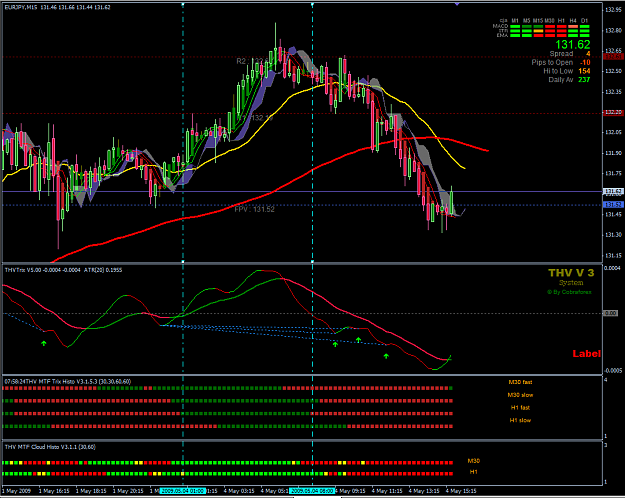
Trend Trading at it's best... — Continuing on with the M15 and higher discussion, here are some techniques I like to use. But first a disclaimer: (( DO NOT use any of these suggestions without doing your homework and testing; make any strategy ...
THV system, final edition

- BeachBum replied Mar 12, 2009
Earlier in this thread I explained that I use THV indicators to establish a trend on a 1H chart using a pair that will NOT have any scheduled news for the next several hours. Then I immediately drop to the 1M and 5M charts to trade WITH the 1H ...
THV system, final edition
- BeachBum replied Sep 30, 2008
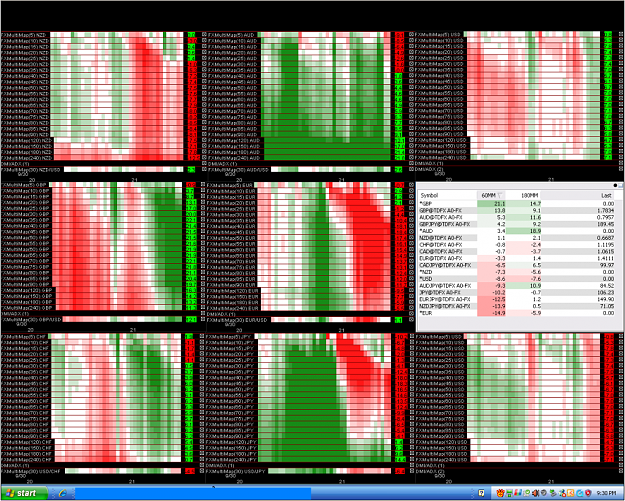
Try this..... — Just use one pair in each window
Individual Currencies & Relative Strength
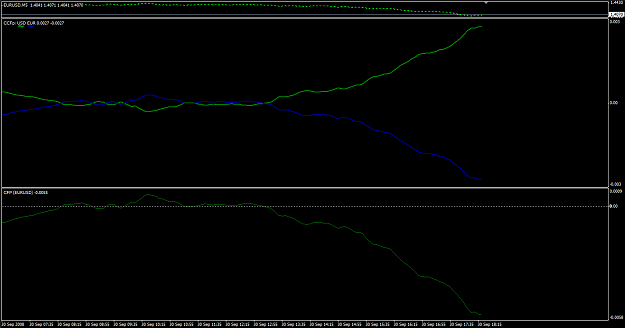
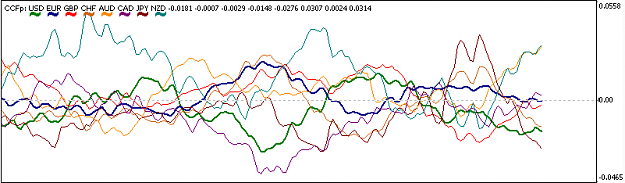
- BeachBum replied Sep 29, 2008
Hmmmmmmm............ — Surprisingly, no-one has posted on this topic. Am I wasting my time here? Here's something I read on this topic that IMO seems relevant: "Relative Strength Analysis To determine the relative strength of a currency, it is ...
Individual Currencies & Relative Strength
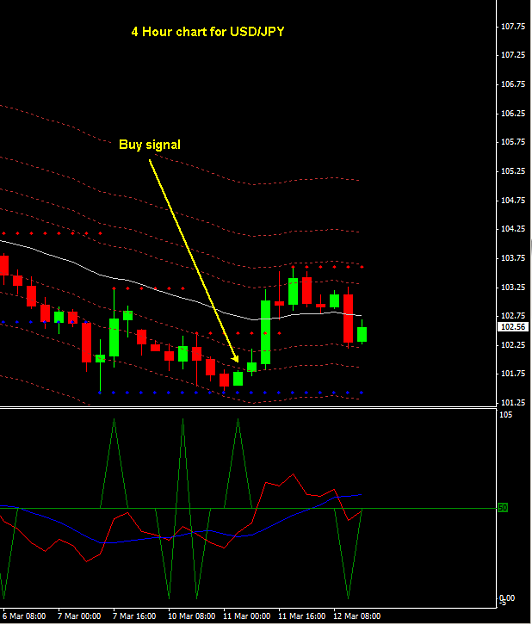
- BeachBum replied Mar 12, 2008
These are very good reasons to keep an eye on the 4 hour chart (if possible) and not rely solely on the Daily. When the RSI is below the MA on the Daily, we should be looking for a "Buy" signal on the 4 hour chart that corresponds to an imminent ...
The Daily Fozzy Method
- BeachBum replied Feb 26, 2008
Average True Range Average True Range Technical Indicator (ATR) is an indicator that shows volatility of the market. It was introduced by Welles Wilder in his book "New concepts in technical trading systems". This indicator has been used as a ...
Breakout + Spread!! Sure!!!
- BeachBum replied Jan 23, 2008
GBP/JPY — I hope everyone got a piece of this pie this AM:
Breakout + Spread!! Sure!!!
- BeachBum replied Jan 22, 2008
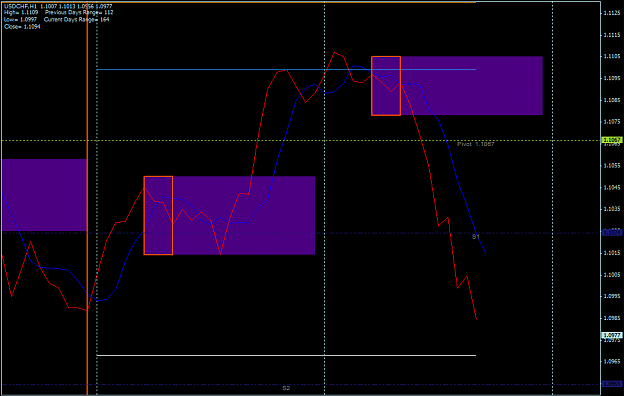
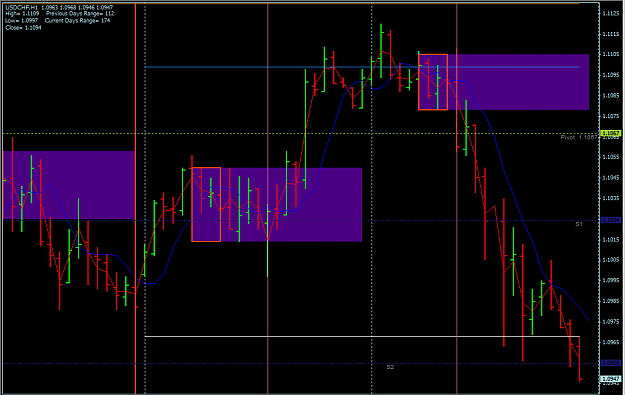
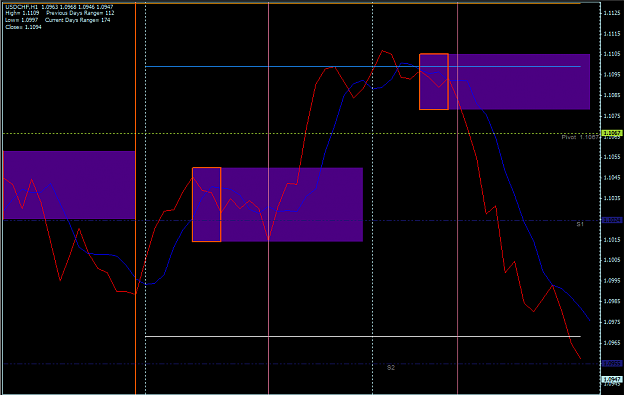
Strategy explained — After examining the posted template, you know I have two MA's to show the current trend on the 1 hour chart. The purpose of the Red line/fast MA is to show where the average price is moving NOW! This will prevent being ...
Breakout + Spread!! Sure!!!
- BeachBum replied Jan 22, 2008
USD/CHF — This is how I like to use the Eagle break-out method; I'll explain it later.
Breakout + Spread!! Sure!!!