- Search Forex Factory
- 406 Results
-
 theDHT replied Sep 13, 2018
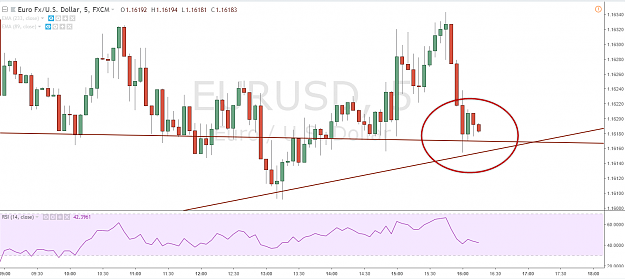
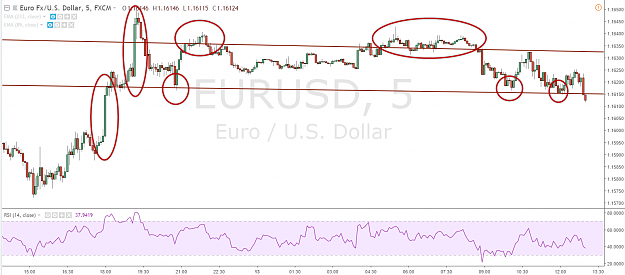
if we break through this, we're could be headed to 1157x M5 image swing target past 1154x would be 1133x
EURUSD only
- theDHT replied Sep 13, 2018
price action this week is deeply suspicious, highlighted by the US session yesterday, when we had two spikes on "headlines" (bullard/nafta), and that was the entirety of the price action for the day (not to mention a lack of volume pretty much all ...
EURUSD only
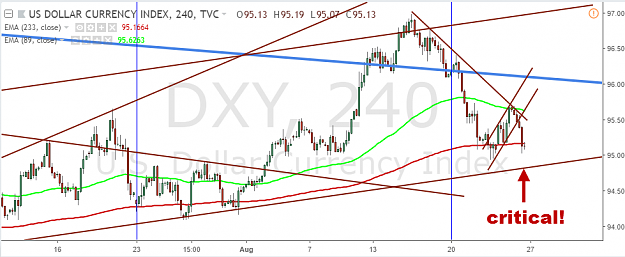
- theDHT replied Aug 29, 2018
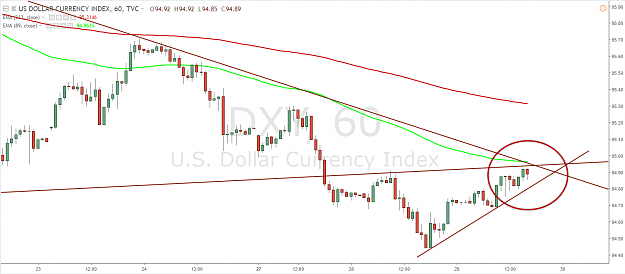
DXY is at a critical junction... confluence of potentially opposing trend lines... play safe
EURUSD only H1 image
- theDHT replied Aug 29, 2018
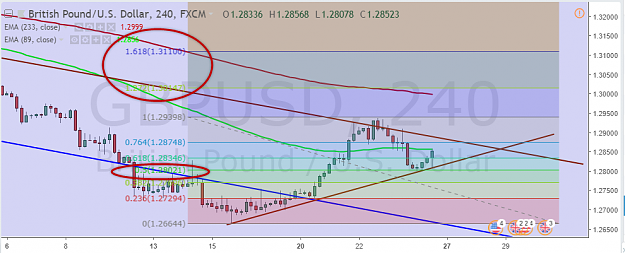
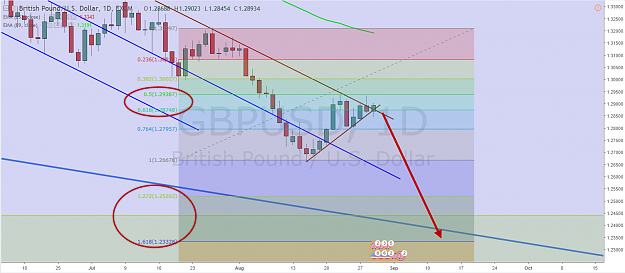
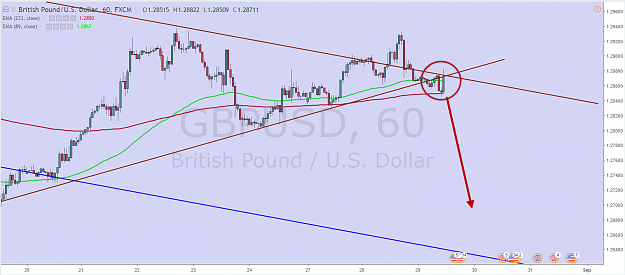
(brain fart) if the bear flag breaks and the above analysis is correct, would imply a swing target of 124xx (multi month support at the dark blue line) on cable, which is roughly 500 pips lets see how it shapes up Cable D1 image
Sultans of Swing
- theDHT replied Aug 29, 2018
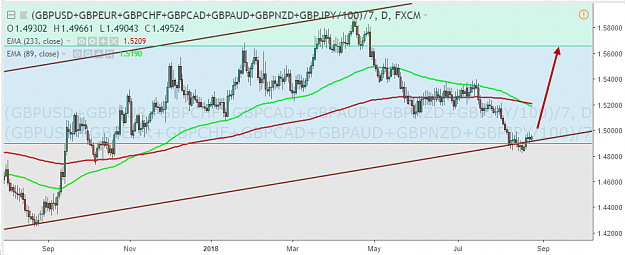
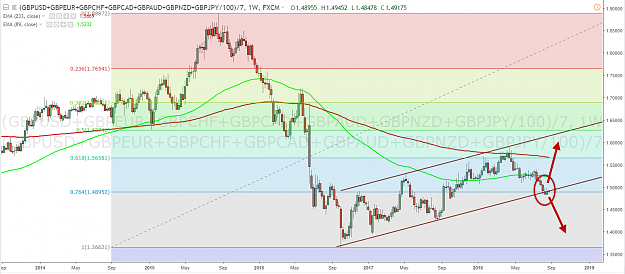
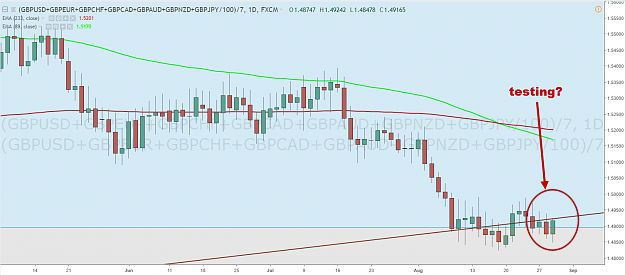
(brain fart) GBP Composite: upon examination today, i noticed an interesting development the daily composite may have broken down and the activity today (unreasonable strength) may be a test of the trend line that was broken D1 image on a weekly ...
Sultans of Swing

- theDHT replied Aug 28, 2018
if the dollar had not been selling off for the last several days, this pair coulda been at 115!! instead its been faffing for about 3 weeks!! however, it may be time for yens to catch a bid soon sadly, it may also be time for dollars to catch a bid ...
USD/JPY Discussion
- theDHT replied Aug 28, 2018
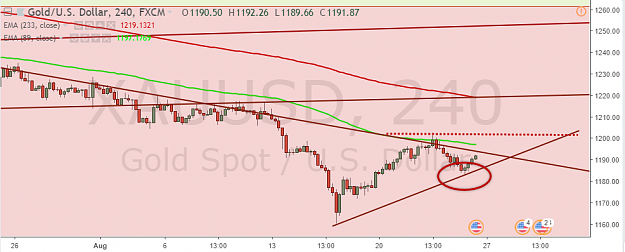
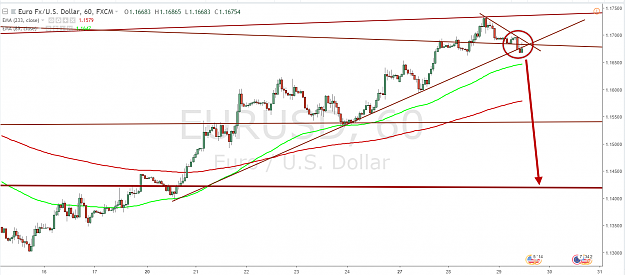
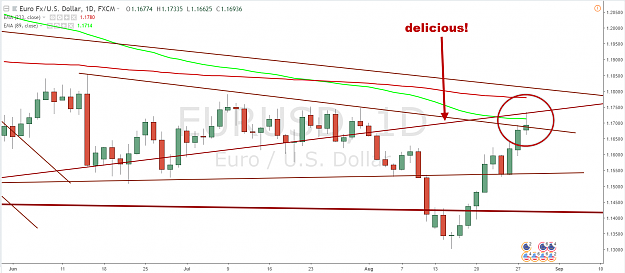
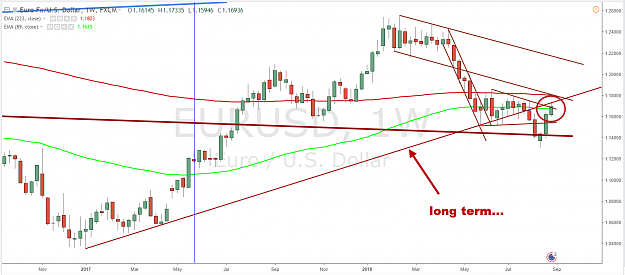
support turned resistance? next stop could be at 1142xx (multi month support), and form a higher low before the real swing starts higher... Weekly image Daily image play safe!
EURUSD only


- theDHT replied Aug 28, 2018
things that make you go "hmmm" EU Weekly image Daily image
Sultans of Swing
- theDHT replied Aug 28, 2018
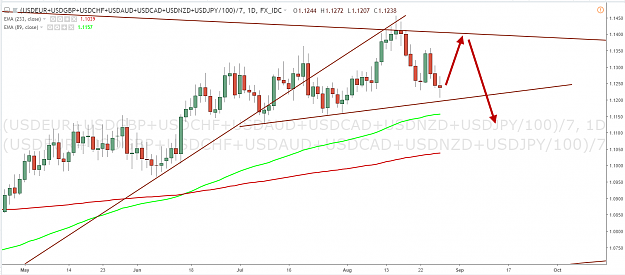
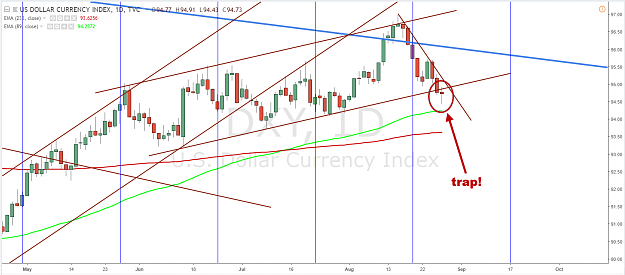
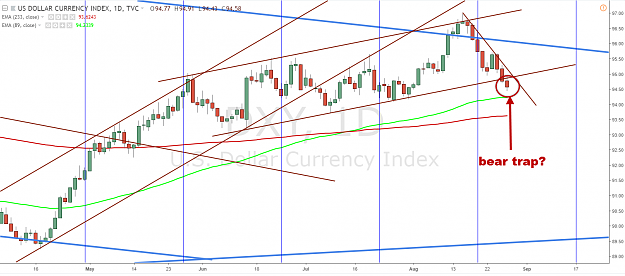
King Dollar mind the trap? DXY D1 image Composite D1 image
Sultans of Swing
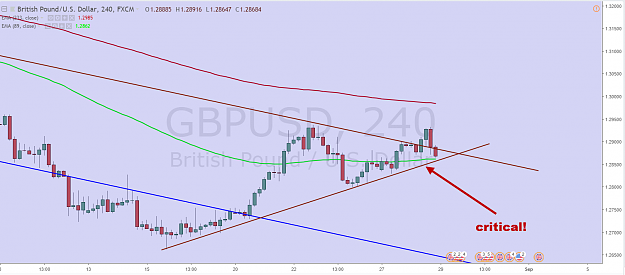
- theDHT replied Aug 28, 2018
this reversal looks ugly if the support line fails, we could have a 200 pip runner to the downside (i have closed my long and taken a short at 1291xx) H4 image
Sultans of Swing
- theDHT replied Aug 28, 2018
to articulate my point. this chart of DXY shows a channel break, but i suspect its a bear trap... a significant channel is rarely broken without ANY meaningful replacements... in this case it would need to be on a daily time frame so i suspect we ...
Dragon Riders GBP/JPY
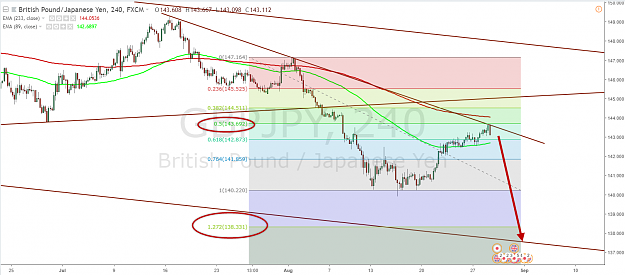
- theDHT replied Aug 28, 2018
H4 image edit: repainted the fibs and added a brain fart
Dragon Riders GBP/JPY

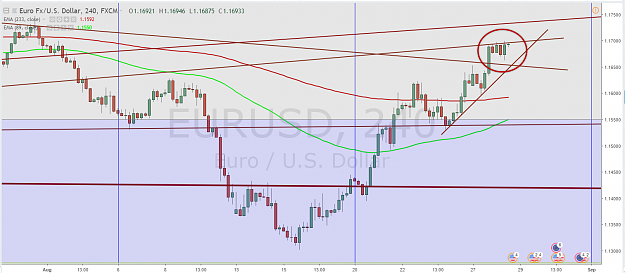
- theDHT replied Aug 28, 2018
may get a reaction on this trend line (support turned resistance) the trend is definitely to the upside tho as previously mentioned: 1172 (almost there), 1184xxx (likely) H4 image short time frame momo divergences are showing up
EURUSD only
- theDHT replied Aug 24, 2018
the structure appears to be validated, and resulted in several of my setups being triggered however, before the dollar bears get overly excited, we need to get across this major demand line and break through the channel next week should be ...
Sultans of Swing
- theDHT replied Aug 24, 2018
2 cents worth Cable H4 image GBP Composite Daily image play safe!
Cable Update (GBPUSD)