- Search Forex Factory
- 42 Results
-
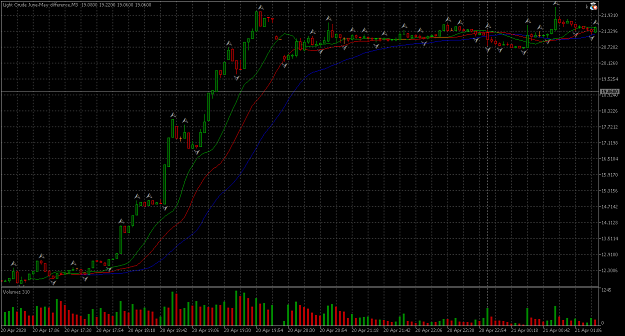
 kypa replied Apr 21, 2020
There is no oil investment, storage price is also floating and reflected in spot/continuus contract on rollover (20-21st almost every month). This is June-May futures contracts difference yesterday: image Holding long oil you pay the down moves ...
Gann Analysis

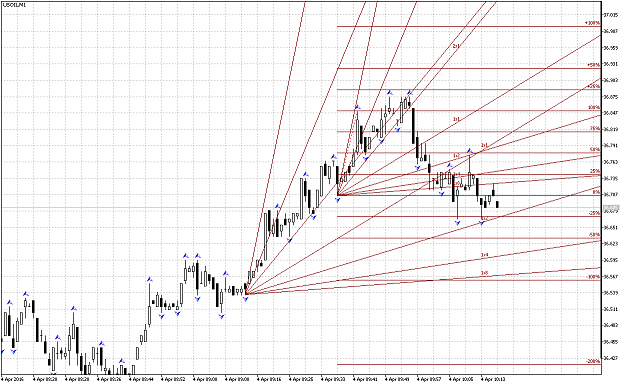
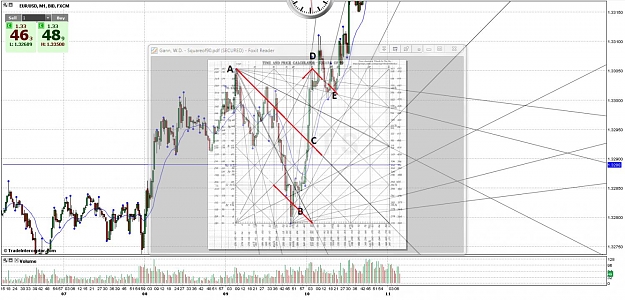
- kypa replied Apr 4, 2016
I should probably explain my example. At 9:37 - 9:40 price makes a bottom under the leading angle - it's not stepping on it for an impulse/trend, but building a range around it. Later price reacts to the middle of this range (the same angle). We can ...
Gann Analysis
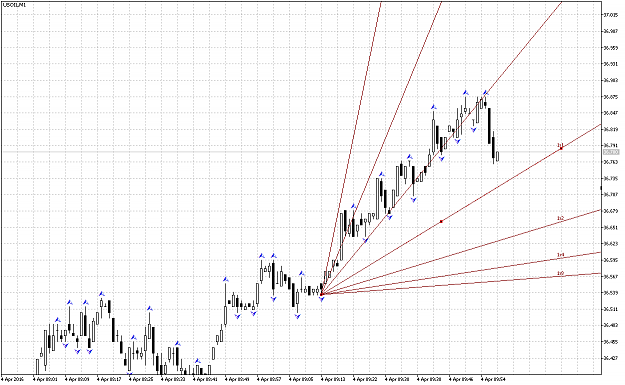
- kypa replied Apr 4, 2016
"It should be 1 cent, but as paper money gets printed into extensive volumes and applied for speculation the main leading cycles become shorter." I'm not totally sure about this part actually, as angles shouldn't change if shorter cycles become ...
Gann Analysis
- kypa replied Nov 18, 2015
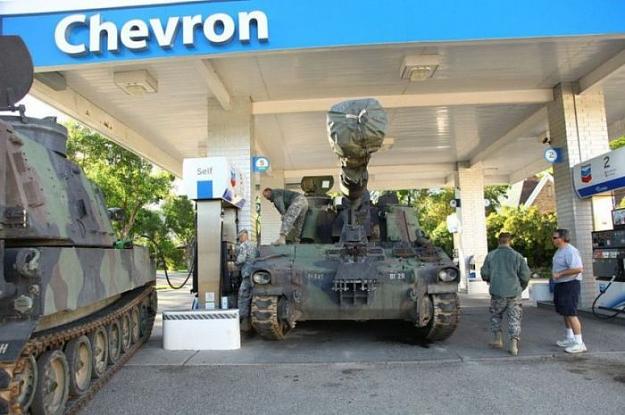
"Do you understand what you have done?" that Cameron baloon though..
Trading Cartoons and Pics

- kypa replied Feb 9, 2013
Squares of Odd (red lines) and Even (blue lines) numbers thru my calculations over the Square of Nine
Gann Analysis support/resistant in a trend or 50% level in a range
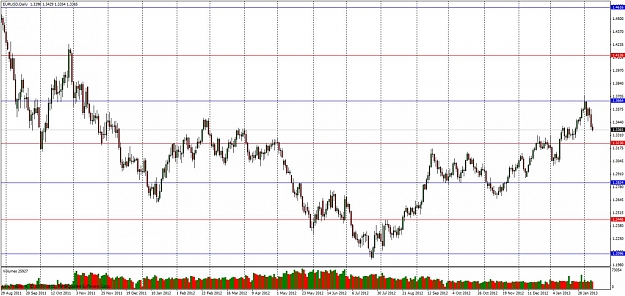
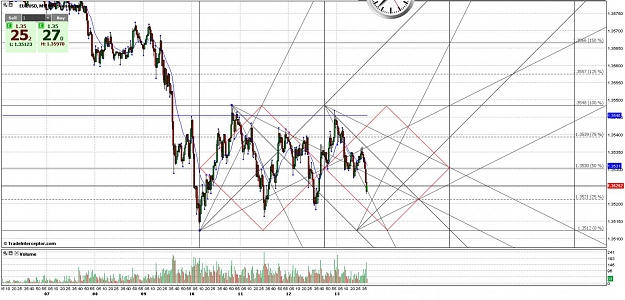
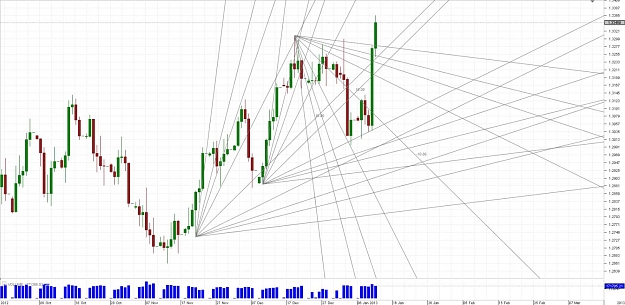
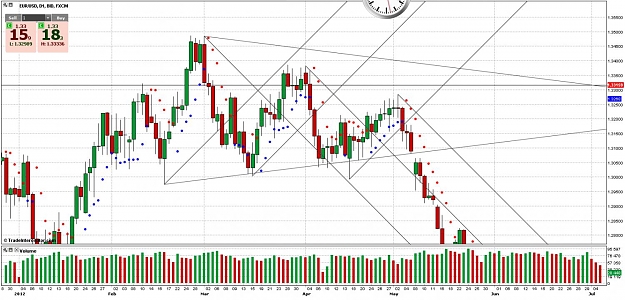
- kypa replied Jan 22, 2013
hourly not-so-long term holidays and weekends euro-dollar picture today downmove looked more like no-demand fall than a high-supply downtrend, immediate recovery proved that and showed large demand at lower prices Despite that great demand that kind ...
Gann Analysis
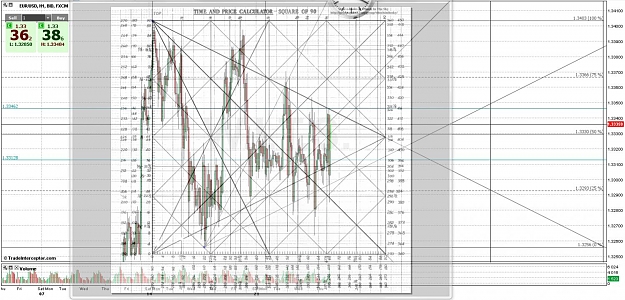
- kypa replied Jan 21, 2013
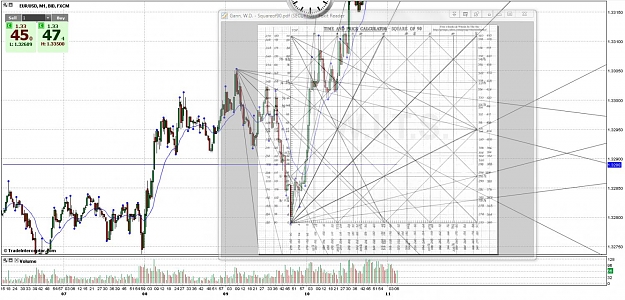
I thought about the purple chart, especially the consolidation january-march 2012: Why would you build a fan at 1.3319, but not from the next two tops and bottoms, since price goes in the consolidation area (both sides in defence). I understand why ...
Gann Analysis
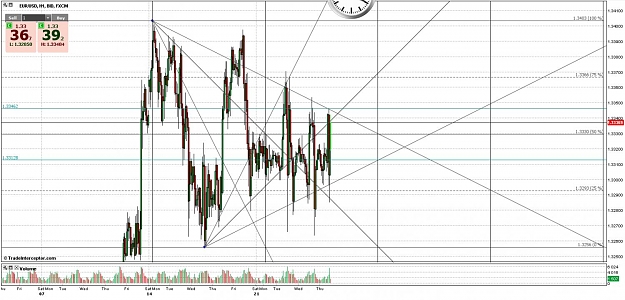
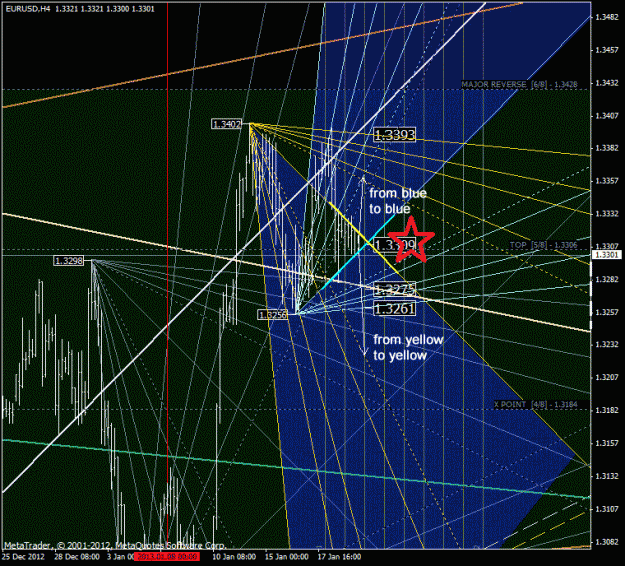
- kypa replied Jan 21, 2013
Godim, how would you define the price action if it goes "between the angles" (where the red star is)?
Gann Analysis
- kypa replied Jan 20, 2013
COT reports sounds optimistic for the euro - 20 percent increase in comercials' short positions and 18 percent increase in leveraged funds' long positions up to last tuesday, although open interest is not much of a big number. British pound shows ...
Gann Analysis
- kypa replied Jan 20, 2013
In my search for "the perfect angle" over the charts there are a few guidelines I have followed: a 1x1 anlge can and should be drawn from every top and every bottom, but there always is a major and a minor. Drawing angles is easy, finding the majors ...
Gann Analysis
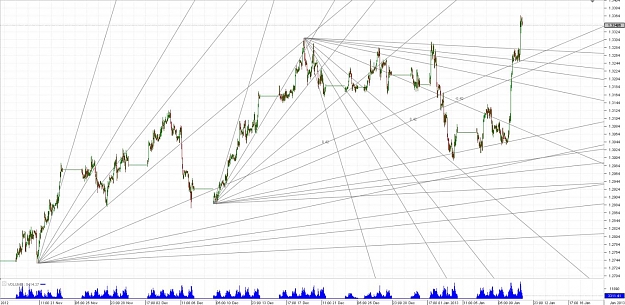
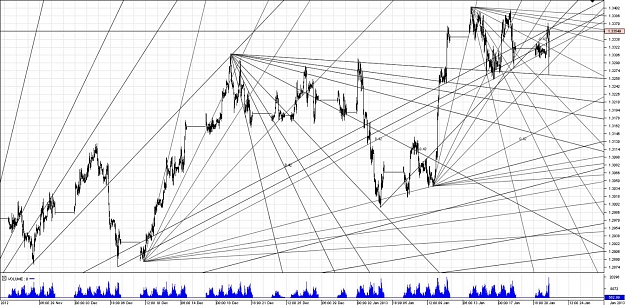
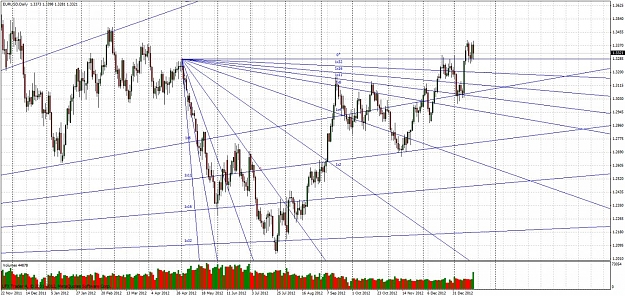
- kypa replied Jan 19, 2013
The longer time elapsed, the more important the 1x11 and 1x16 angles become, no matter the scaling these angles are amazing. In fact a different scale should be just one more point of view Bullish angles start from June 2010 bottom
Gann Analysis
- kypa replied Jan 17, 2013
As a financier wannabe I wish to propose a logic behind the squares - "if Supply has been at (A) and Demand at (B); afterwards Supply hasn't move to (C) but to (D) and afterwards Demand has moved to (E), we may conclude that there has been no ...
Gann Analysis
- kypa replied Jan 15, 2013
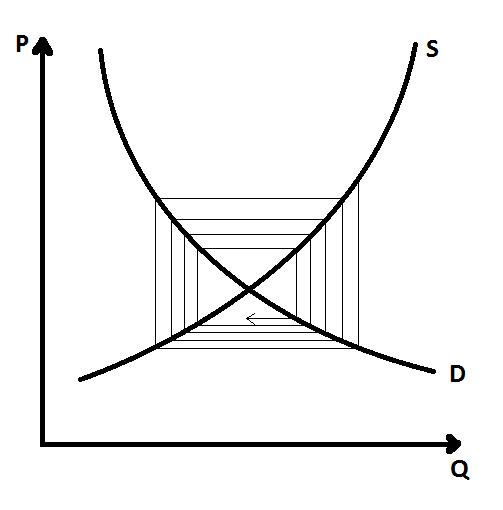
This is the first chart I have studied in economics first year in highschool. It represents supply and demand plotted in price/quantities (volume) terms. The spiral movement represents the market's search for equilibrium. This is the "static" ...
Gann Analysis
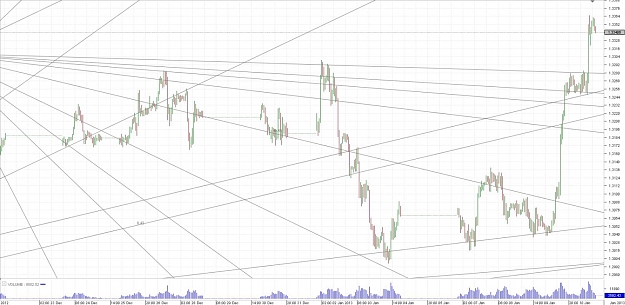
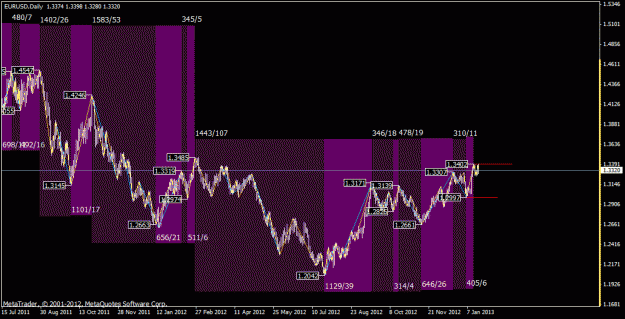
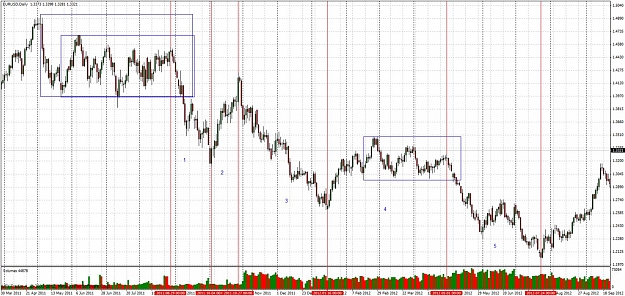
- kypa replied Jan 11, 2013
one more addition to the eurusd dailies, holidays and weekends included in this one, timing angles adjusted, underlines the importance of 10.01
Gann Analysis