- Search Forex Factory
- Bollinger Bands & SMA for the 1Min & 5Min ChartsStarted Apr 8, 2020|Trading Discussion|29 replies

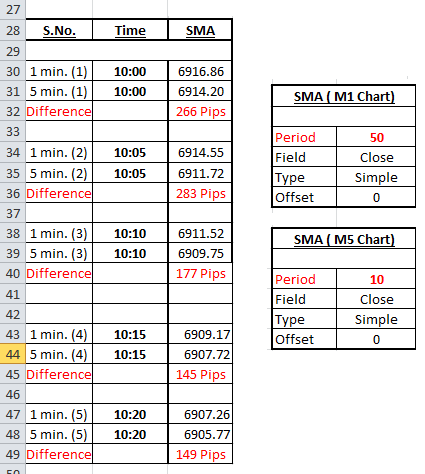
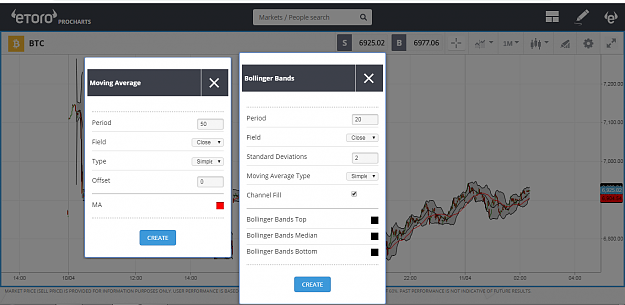
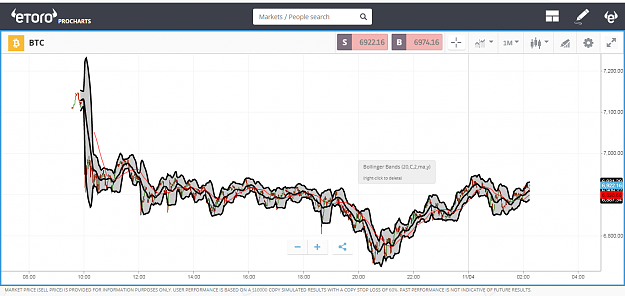
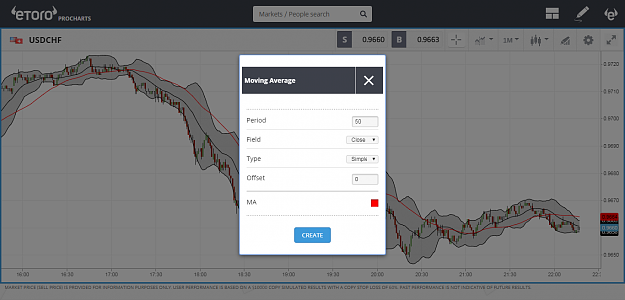
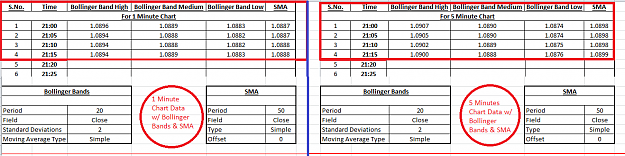
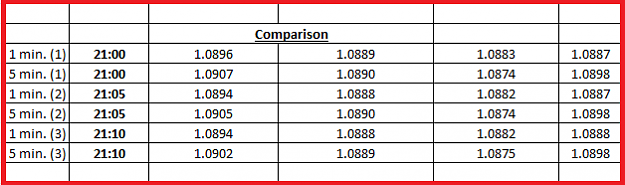
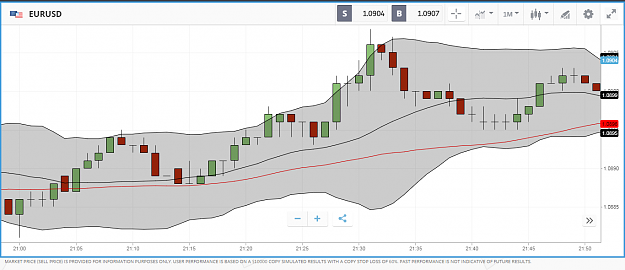
I am using Bollinger Bands and SMA Studies for the etoro Charts in 1 Min. & 5 Min. Time Frames.. ...
I am using Bollinger Bands and SMA Studies for the etoro Charts in 1 Min. & 5 Min. Time Frames.. ...