- Search Forex Factory
- 25 Results
-
 cesarg replied Apr 26, 2011
1.0690 hold by now — 1.0680 hold by now as i expected due to these strong bull run (the pair touch this area just 3 times before 81-82). 1.0770 broken; if there is any, the retest of the area must to hold to see the target of the 4h bull flag ...
AUD/USD
- cesarg replied Apr 22, 2011
Monthly Chart — Just a little chart, show us several levels to watch carefully, based on fibos and historical High-low point The weekly candle close above another resistance line (1.0687, low in 1980(!!!), and level broked and rejected in ...
AUD/USD
- cesarg replied Mar 1, 2010
long at 4786 target 5803...
Cable Update (GBPUSD) reached the lower band of daily channel i see... who knows.... anyway, protected at +4 one daily view:
- cesarg replied Aug 23, 2009
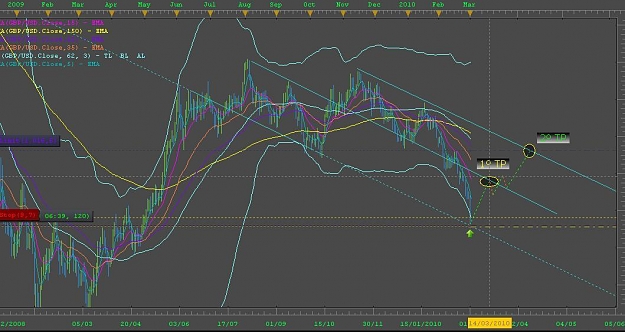
hello people!!! i draw this chart in oct-09-08, just in the middle of the downtrend... attached to this post into the Cable Update thread.... ( url ) url I wonder if we will touch the lower line before fall quickly again after one year... or if we ...
Trade what you see NOT what you expect
- cesarg replied Aug 10, 2009
Hello everybody!!... still short from 1.6717. i think we will find a lot of buyers around 1.6230 zone, but first it is needed reach it
Trade what you see NOT what you expect...:
- cesarg replied Apr 2, 2009
just a thought, looks the daily like a double top into a triangle formation? and then looks the weekly like a bear pennant?... who knows...
Trade what you see NOT what you expect
- cesarg replied Mar 28, 2009
i see that we have a nice shooting star on weekly... or am i wrong?
Trade what you see NOT what you expect
- cesarg replied Feb 26, 2009
maybe a rising three method formation in 4H. I hope it doesn't because of my short position.
Cable Update (GBPUSD)
- cesarg replied Feb 24, 2009
ohh my mistake. very sorry. Cup of tea, or cup and handle, bullish formation and thanks for show me my error too. i don't know why i have in my mind this formation for bearish continuation.... very sorry... so the chart must looks like this:
EURUSD
- cesarg replied Feb 24, 2009
is not a head and shoulders, but could be a "bump and run" which is reversal formation too. in the first step, move fastlly up, and make HH, then can't keep, and continues making LH slowly, till definitively fall under the original trendline.
Cable Update (GBPUSD)
- cesarg replied Feb 17, 2009
hi eohater, this is mine 4H, red is 5 and purple is 10 SMA and the gree one is 50.
Cable Update (GBPUSD)
- cesarg replied Feb 14, 2009
3 falling peaks???? — assuming the continuation of the bearish scenario, and possible H&S pattern in 4H chart, we could get a big pattern confirmation in 4h and daily charts. and is still bearish: 3 lower highs, and 3 lower lows but not ...
Cable Update (GBPUSD)
- cesarg replied Feb 13, 2009
possible 4H H&S — head and shoulders formation in progress???
Cable Update (GBPUSD)
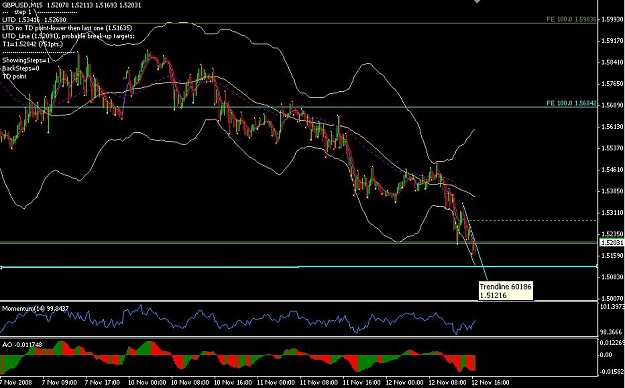
- cesarg replied Nov 12, 2008
Testing the Yearly trendline placed around 1.5130-1.5120... a close below this line ..... .... .... .... WOW
Cable Update (GBPUSD)
- cesarg replied Nov 10, 2008
i don't know if Uchf will break the 1.18 area... At least, a bearish wedge is formed in daily & weekly and now we are exactly at the top... i play for a short @ 1.1779 targeting 1.12 at least.... SL 1.1815 How i wish a beautiful fall!!! Aware the ...
Cable Update (GBPUSD)
- cesarg replied Oct 28, 2008
closed at 6035. +405 beautifulllllllll!! image Going short from here (1.6041) sl: 1.6080. but i think we can go to 1.6280.... we see..
Cable Update (GBPUSD)
- cesarg replied Oct 28, 2008
i still think cable will touch 6040 before fall like a rock. long at 1.5630 (sl +20) target 1.6035
Cable Update (GBPUSD)