- Search Forex Factory
- 257 Results
-
 b2st replied Dec 30, 2012
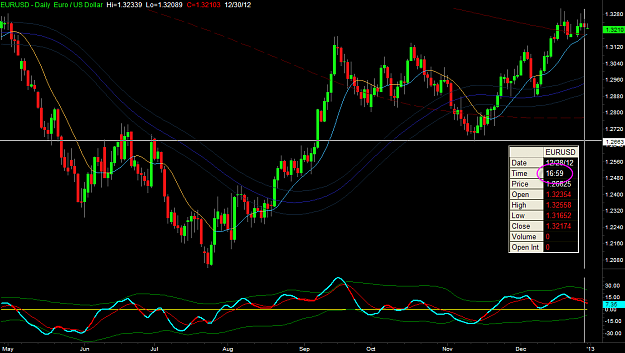
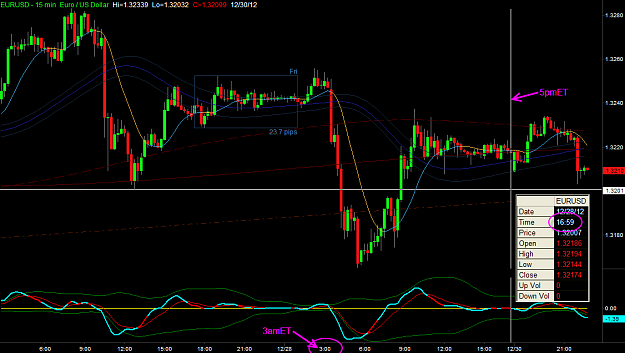
1. Daily candle close at 16:59 (5pmET) New York Eastern Time. The time-axis is in NY ET. 2. There will always be complaints. Some will eventually close account and some will stay on to feedback on the TS Forum either at EasyLanguage Support or ...
TradeStation for trading forex?
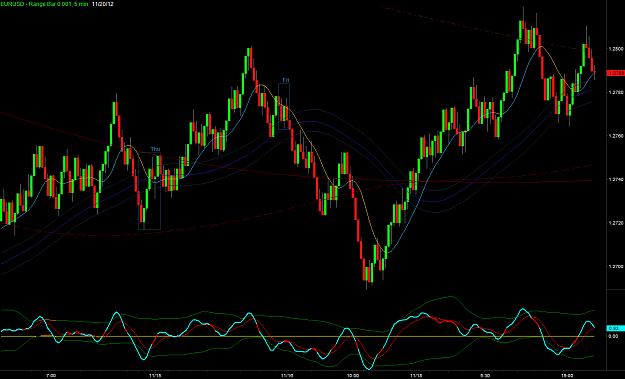
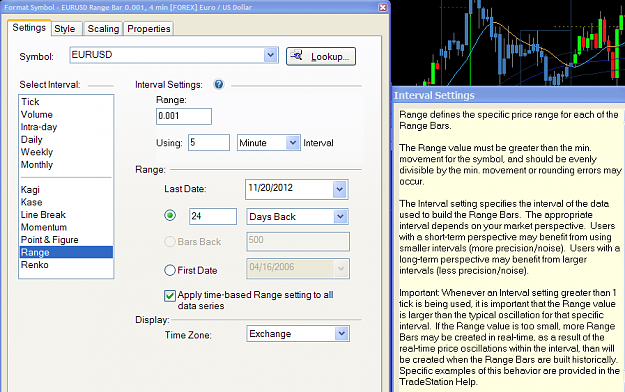
- b2st replied Nov 20, 2012
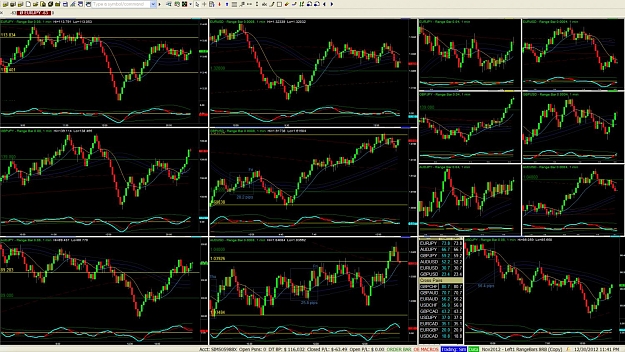
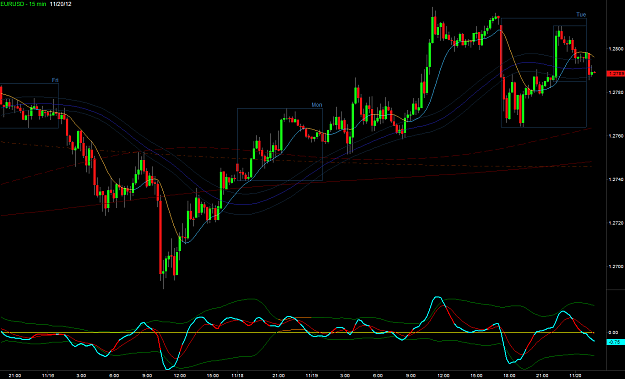
TradeStation.com has Range Bar chart support. Below is comparison of regular 15mins EUR/USD chart with Range Bar 10pips EUR/USD.
Thoughts: RangeBar/RenkoBar how to do it?
- b2st replied Aug 28, 2012
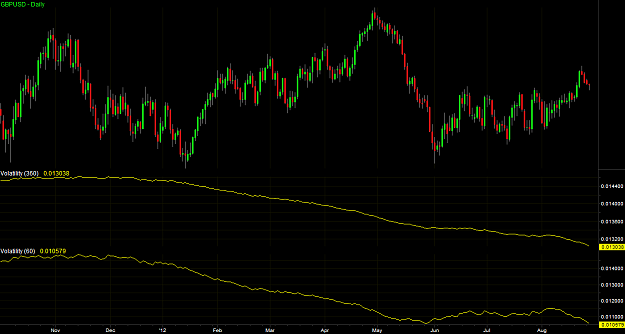
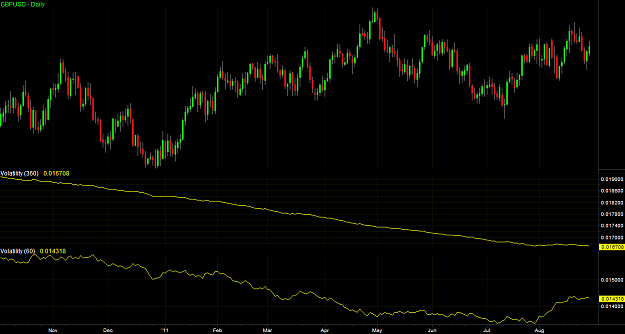
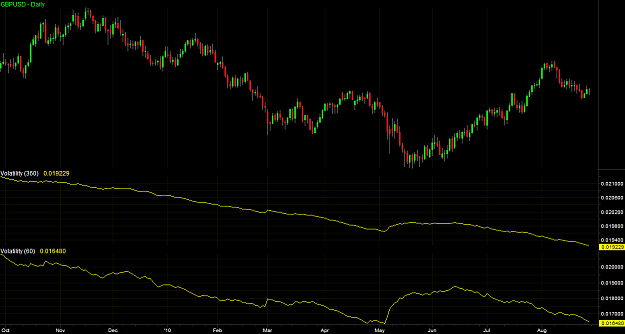
For GBP/USD, the average daily range for 2012 is 130.38pips which has been falling steadily since 2011's 167.08pips and 2010's 192.29pips.
Is August the most difficult trading month?
- b2st replied Aug 28, 2012
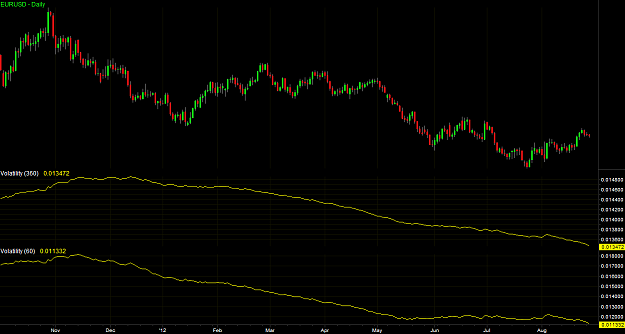
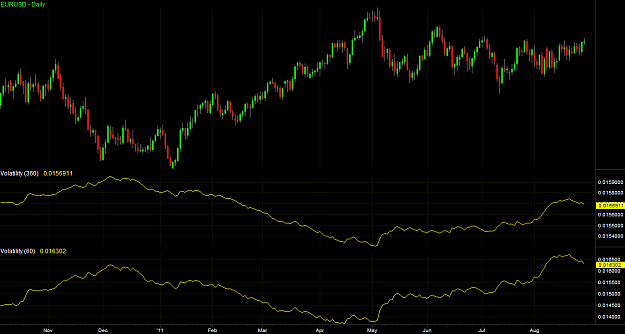
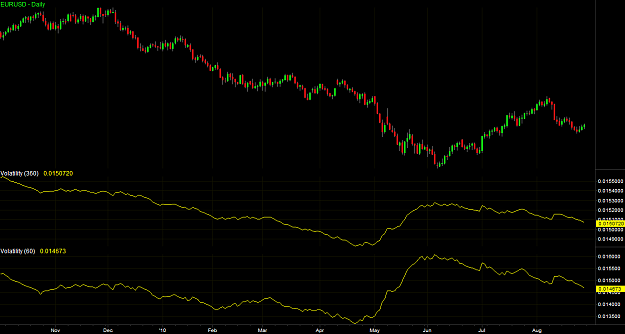
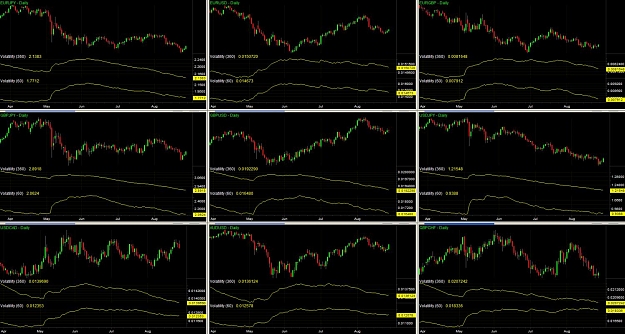
Here's a closer look at EUR/USD. The indicator readings represent the average daily range in pips, measured over 360-period and 60-period. The chart for 2011 showed that it isn't always true that August is the worst month to trade. Financial ...
Is August the most difficult trading month?
- b2st replied Aug 28, 2012
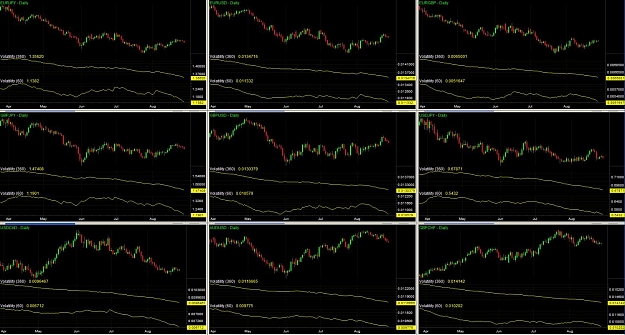
In below charts, the volatility for 9 pairs are compared for past 3 years (2012, 2011, 2010) as of same date Aug 28. EUR/USD is the top row center column chart where you see that the average daily range over 360 days has dropped steadily to around ...
Is August the most difficult trading month?

- b2st replied Jun 15, 2012
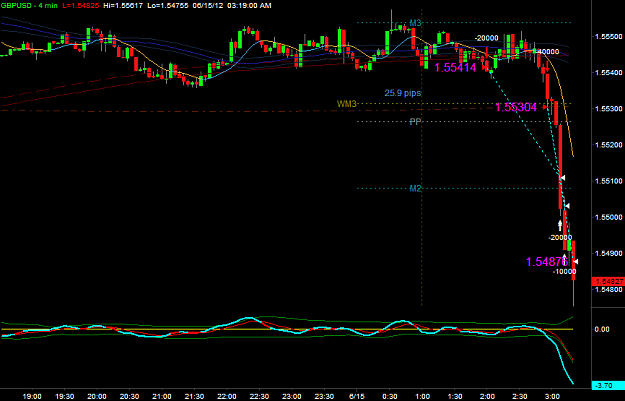
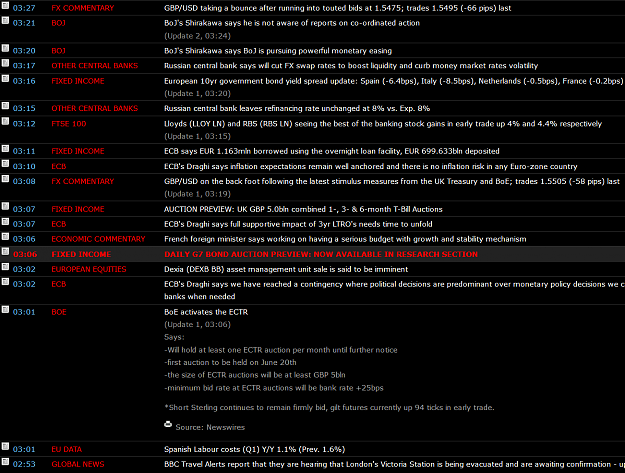
Lucky trade. Caught the quick GBP/USD drop with the BoE news at 3:01amET, took profits at 1.54875 before touted bids at 1.5475 (see 3:27amET commentary).
EU & GU Daily trading Signals
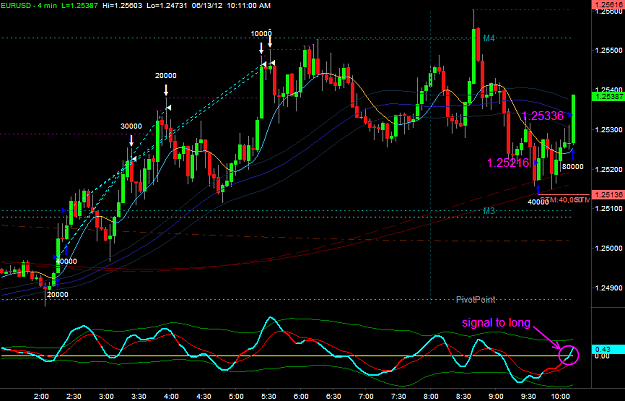
- b2st replied Jun 13, 2012
I have matching signal at 10:12amET to go long EUR/USD at 1.25336 (already in earlier at 1.25216). Hope it works so late into the day. Bottom picking GBP/JPY didn't work as well.
EU & GU Daily trading Signals
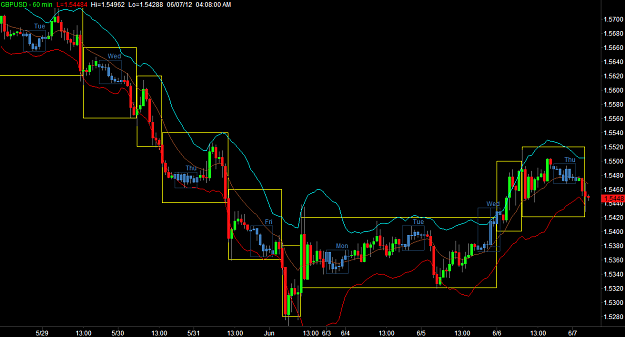
- b2st replied Jun 7, 2012
We have UK news today so I'm expecting GU to be stuck between 1.5420 and 1.5520. So unless you have a good position near the top (for short) or near the bottom (for long), I'm forcing myself to stay aside until the 4:30amET and 7:00amET news ...
EU & GU Daily trading Signals
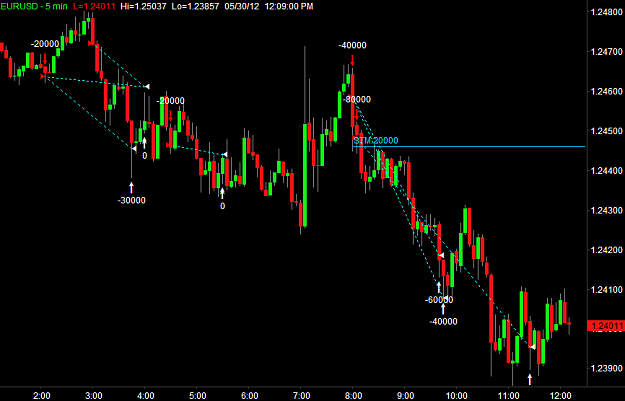
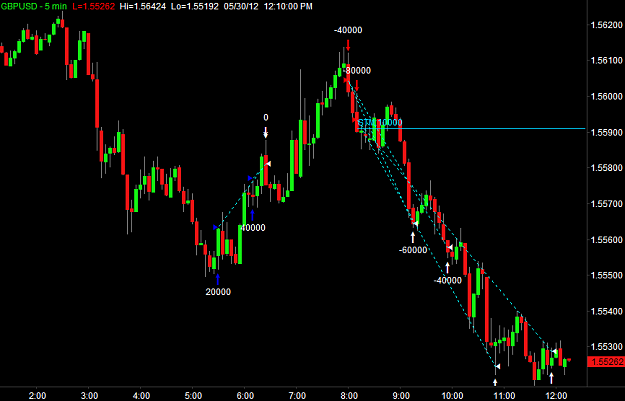
- b2st replied May 30, 2012
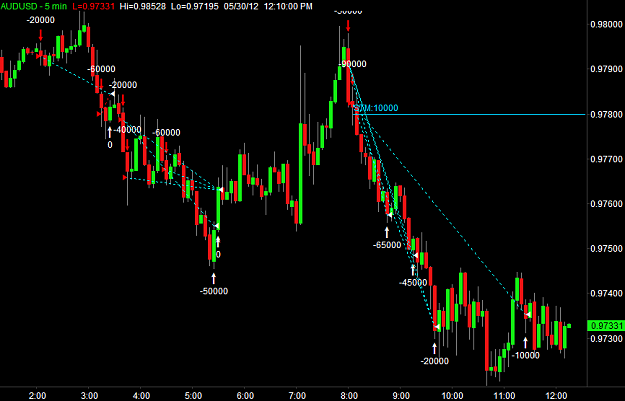
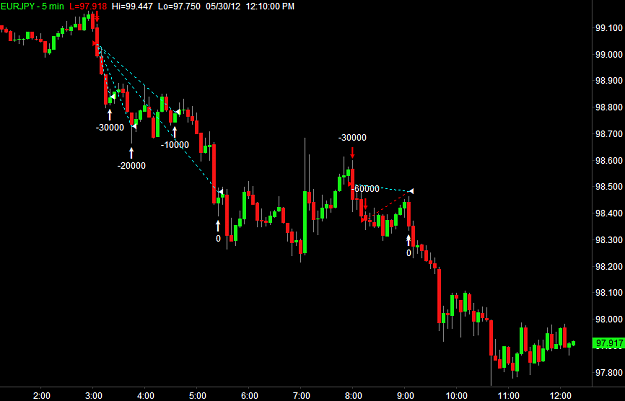
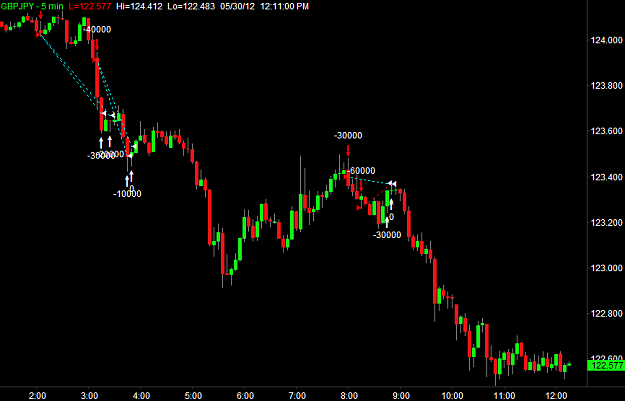
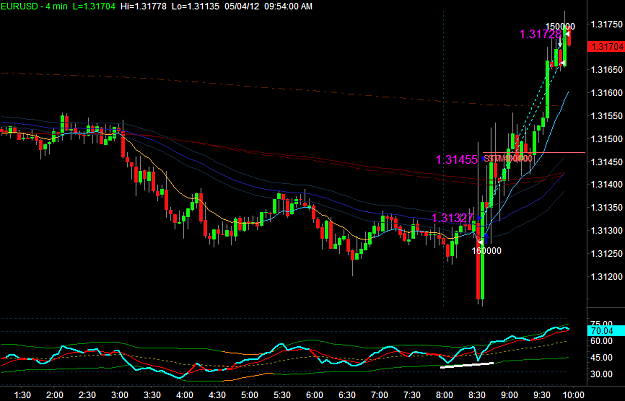
Here are some pictures of TradeStation charts when the 'Account Orders & Positions' setting is turned on. It shows the entry/exit markers and position sizes (10,000 = 1 mini-lot). The vertical (price) axis can be customized to e.g. 20pips or 50pips ...
TradeStation for trading forex?
- b2st replied May 5, 2012
In my view, the auto-marker feature (blue triangle for Long entry, red triangle for Short entry, white triangle for exit) is the best learning tool for traders. You can see from the markers and dotted lines how you have traded the chart and learn ...
TradeStation for trading forex?
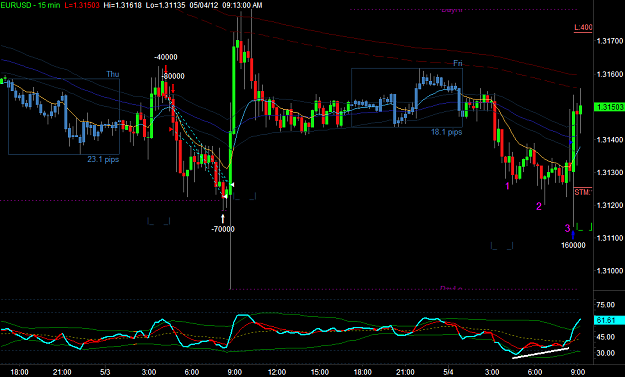
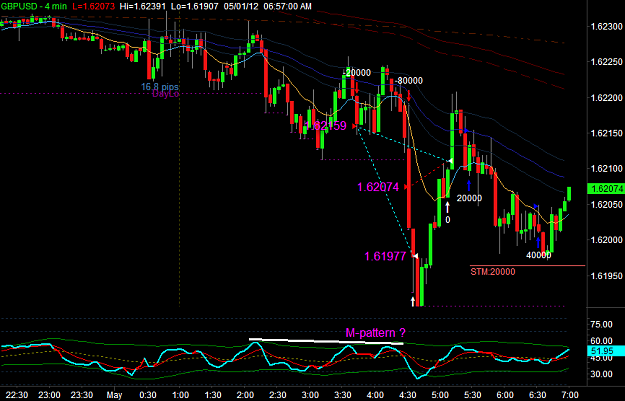
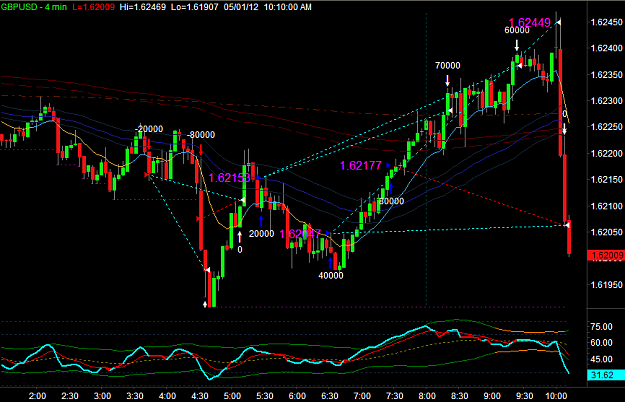
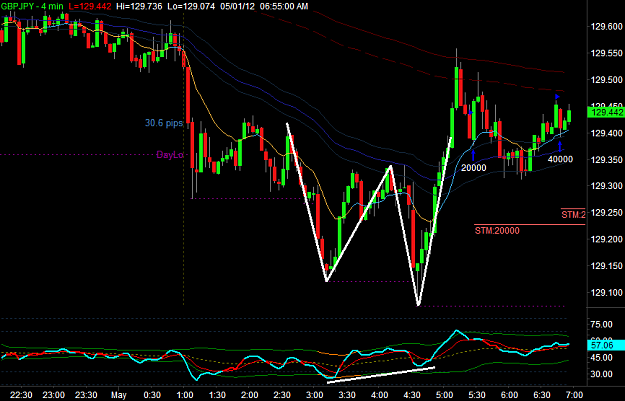
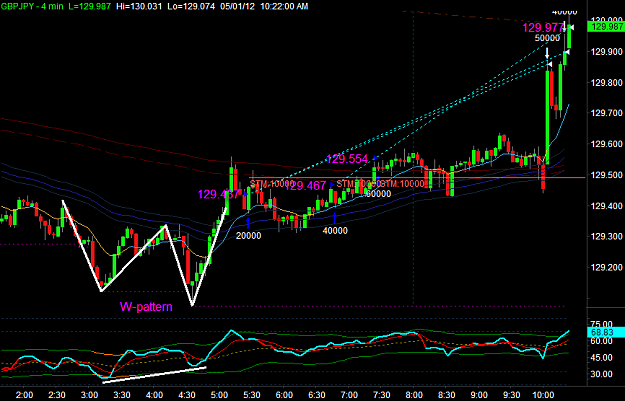
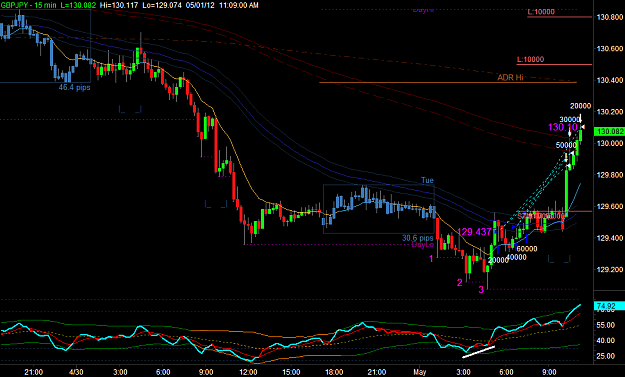
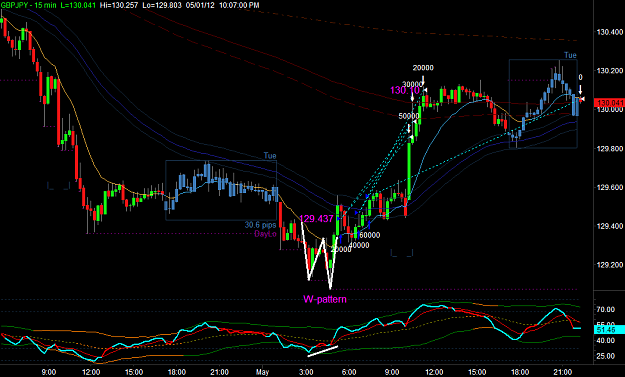
- b2st replied May 1, 2012
Tuesday - Labor Day — GBP/USD my initial bias was bearish (possible StraightAway), so shorted 1.62159 and added 1.62074. However, GBP/JPY formed 15mins bullish W-pattern at 4:45amET and so had to scratch this short trade for +18pips. GBP/USD ...
M&W-Trading
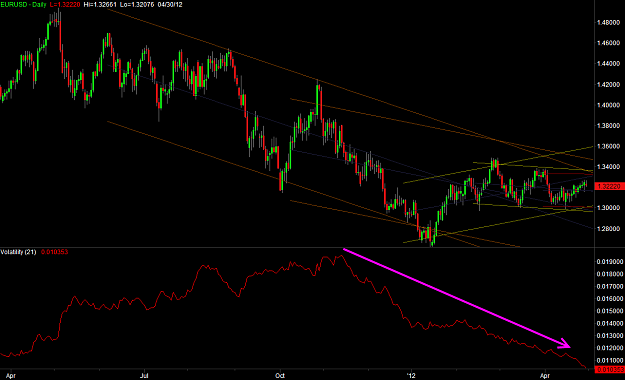
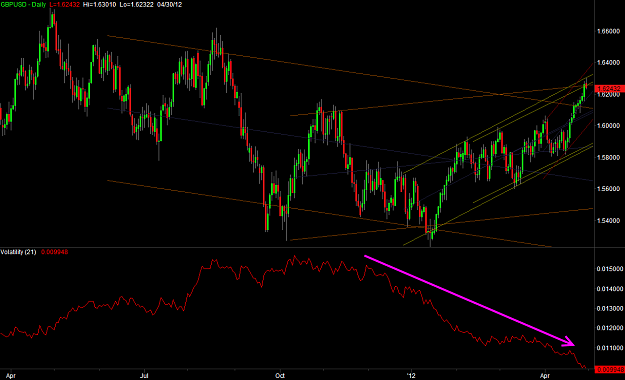
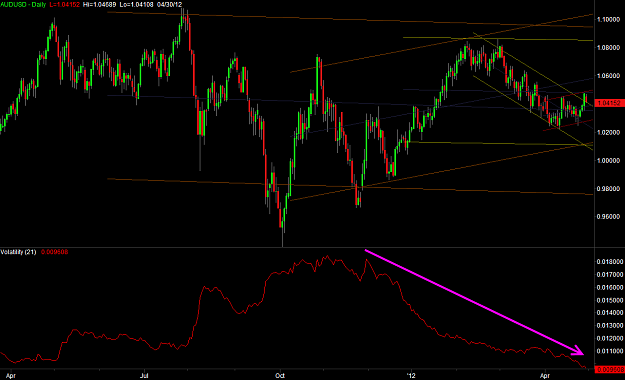
- b2st replied Apr 30, 2012
Intraday volatility has been steadily falling on major pairs since November last year. What this means is that if you trade 15mins charts and use a 20pips stop loss, you could expect to capture half to two-thirds of ADR (average daily range) from ...
M&W-Trading
- b2st replied Apr 30, 2012
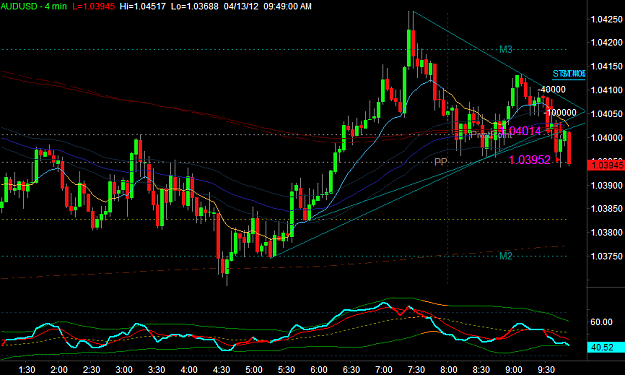
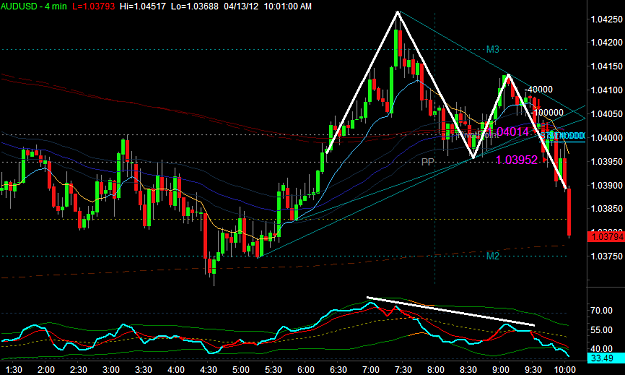
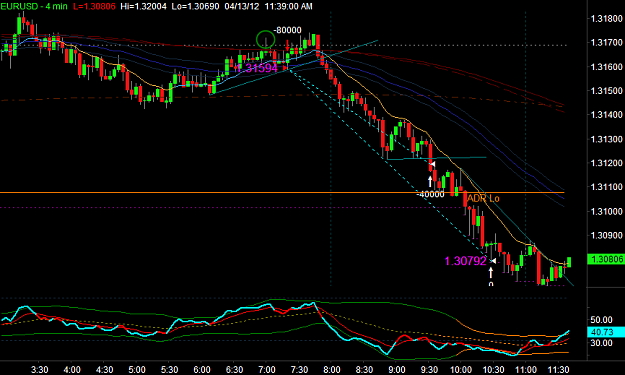
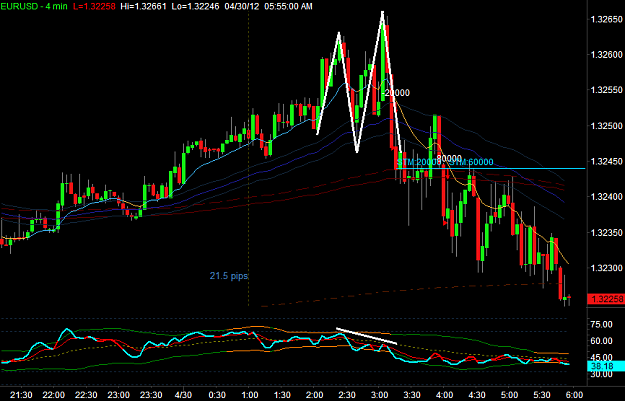
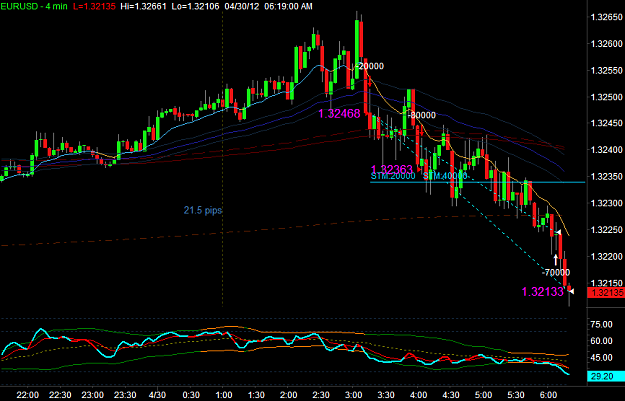
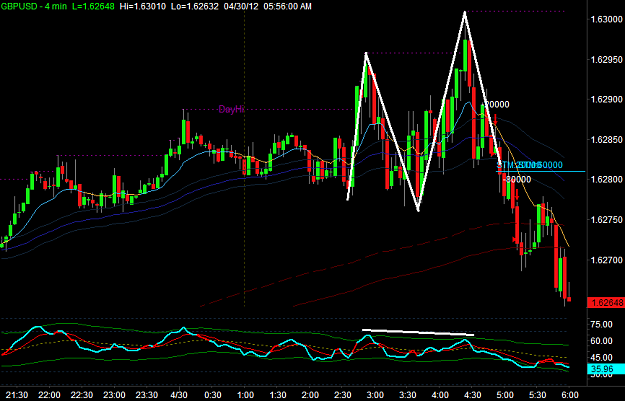
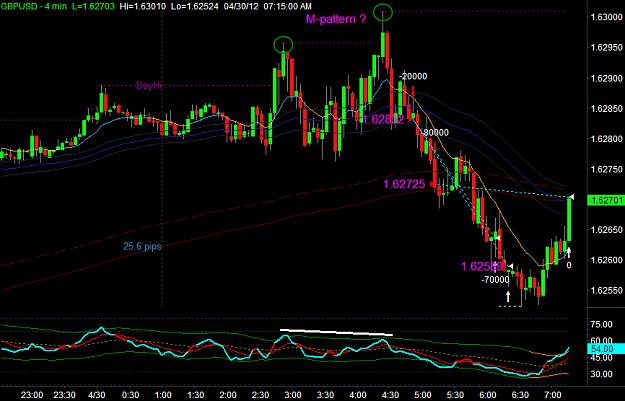
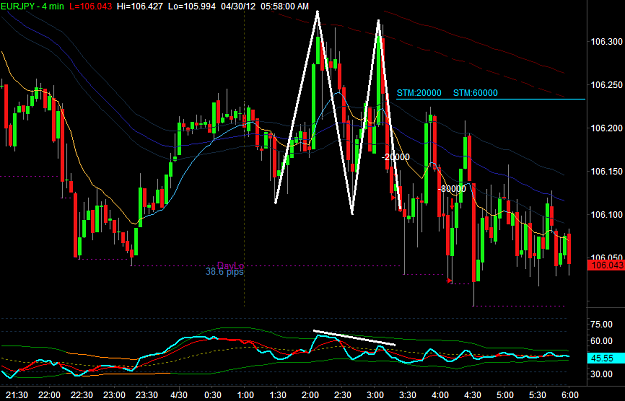
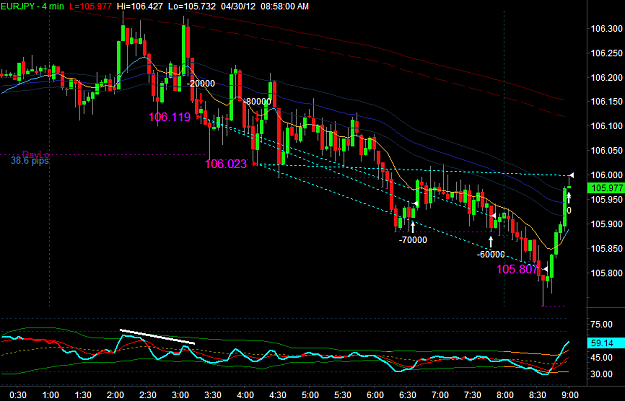
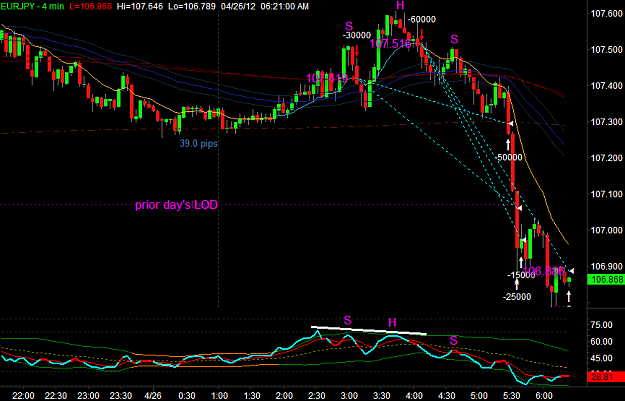
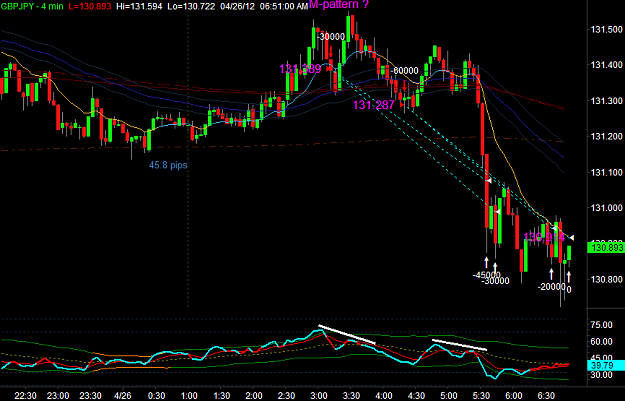
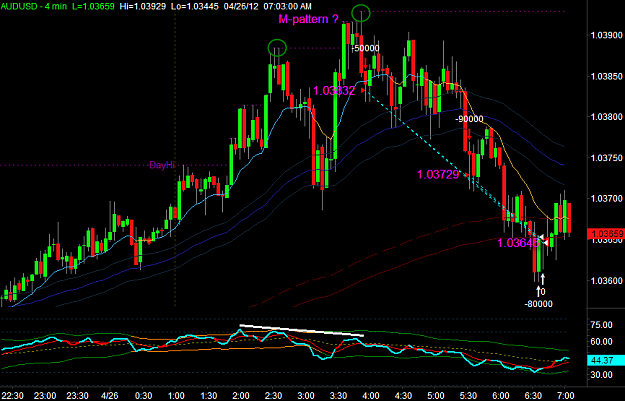
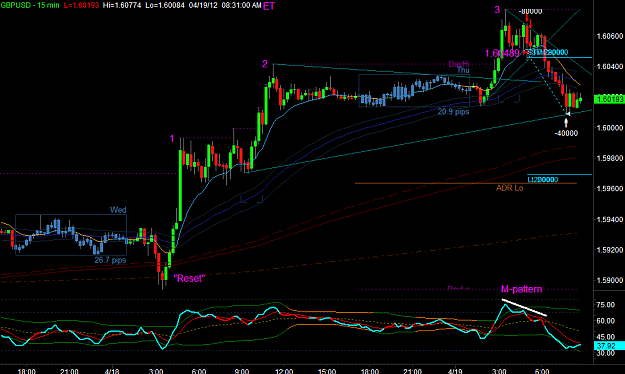
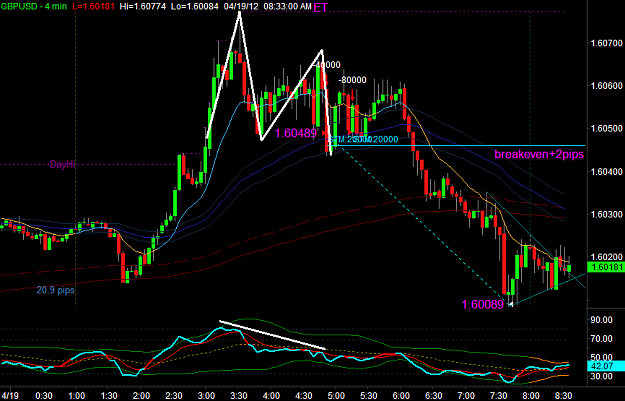
Monday — EUR/USD, GBP/USD, EUR/JPY seemed to show M-pattern on smaller timeframes (4mins), during and just before London open. Once we identified the HOD signatures (false move beginning of week), we can still scrape out winners even on a ...
M&W-Trading
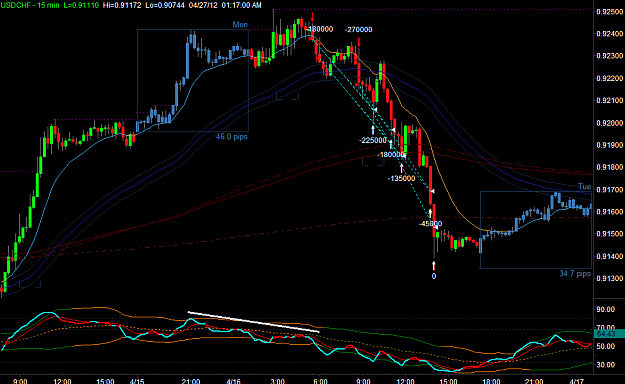
- b2st replied Apr 27, 2012
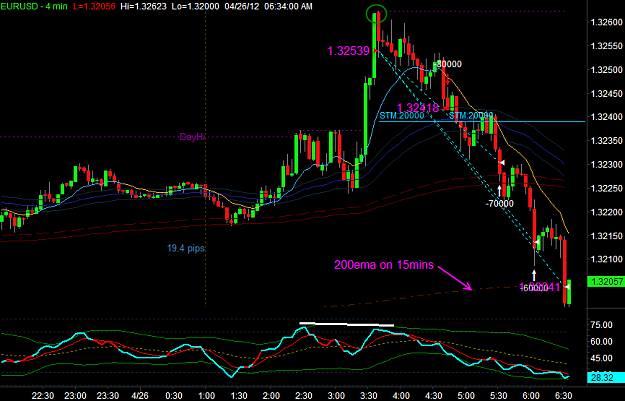
Since we use 13ema/50ema/200ema (and 800ema), we know that these moving averages are factors of "4". So the 50ema on 1hr chart is represented by 200ema on 15mins chart, or the 13ema on 4hrs chart is represented by 50ema on 1hr chart. 4hrs ---> ...
M&W-Trading
- b2st replied Apr 26, 2012
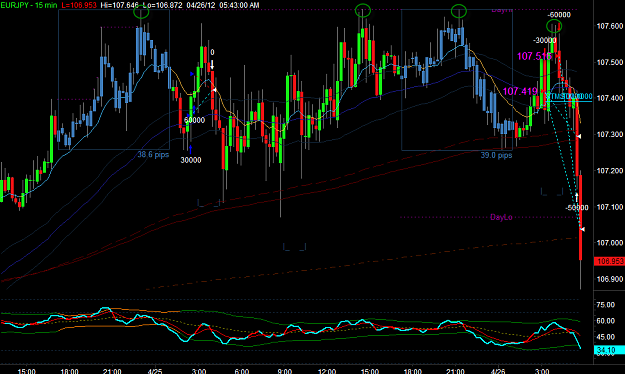
possible mid-week reversal? — EUR/JPY on 15mins chart showed multiple hits to the highs (indicated by 4 green circles). best entry 107.516 and best partial exit 106.886, for +63pips. took partial profits along the way. GBP/JPY was tandem trade ...
M&W-Trading
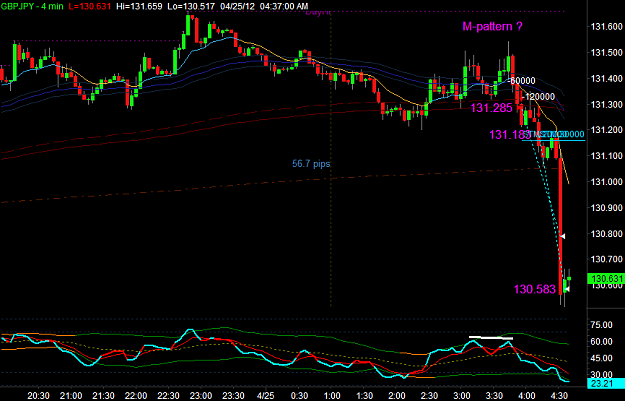
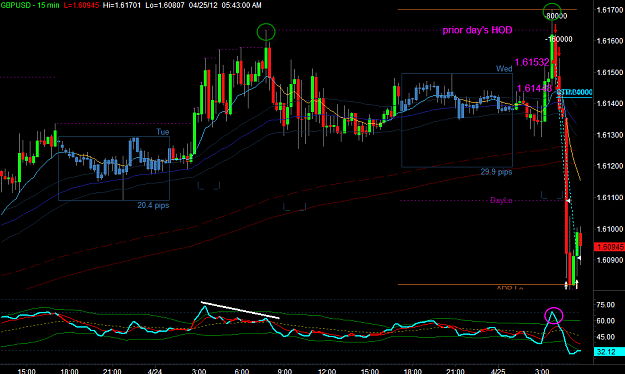
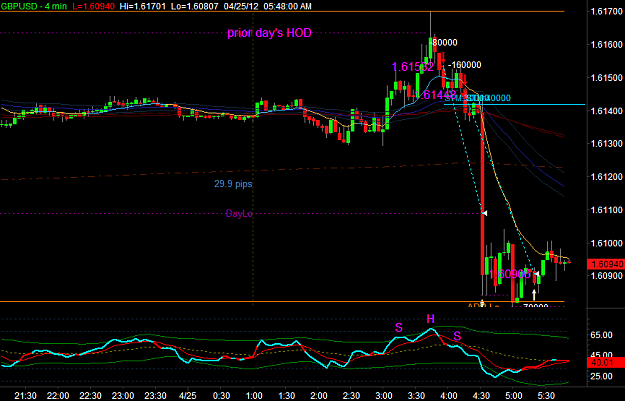
- b2st replied Apr 25, 2012
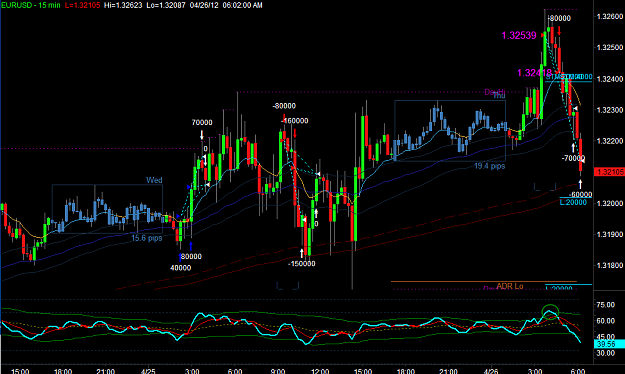
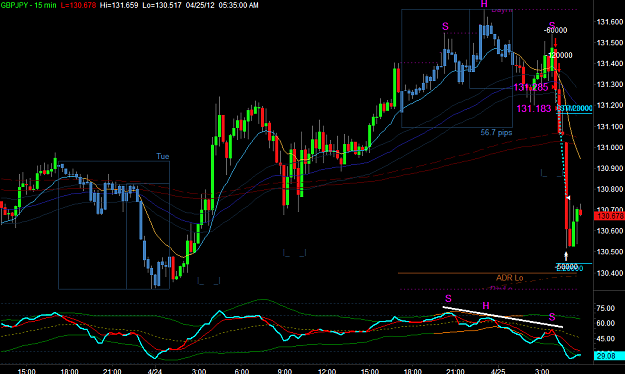
i don't think this thread will work ...... — GBP/JPY showed head-and-shoulders reversal formation on 15mins chart, possible short entry at 4:00amET. GBP/USD at the same time showed multi-day M-pattern on 15mins chart (indicated by two green ...
M&W-Trading
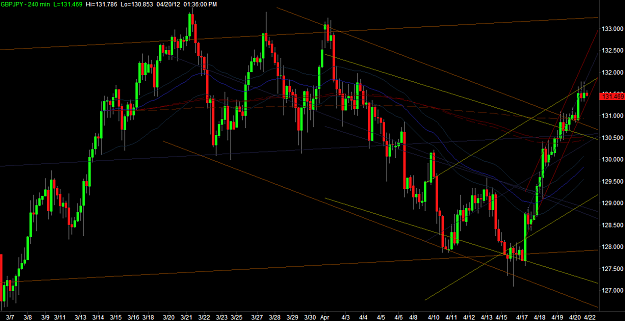
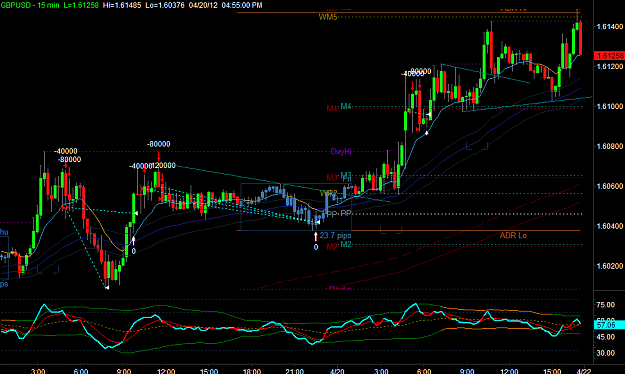
- b2st replied Apr 20, 2012
The "timing" might not be ideal ...... this is the end of week and if it hadn't reversed (down) by 10:45-11:30amET Friday it probably could just keep drifting higher, volume dwindling after London close. It would be high odds to try shorting if this ...
M&W-Trading
- b2st replied Apr 19, 2012
I received mailers from Vertue Trading from the same email I subscribed to YTR. Do you get the same mailers?
Your Trading Room (YTR)
- b2st replied Apr 19, 2012
Thanks guys! I think we really need someone to come here and "teach" this Method on regular basis, answer newbies questions, and provide support to MT4 indicators/templates. Something like the Trading Systems Forum, or the Commercial Forum. Here, ...
M&W-Trading
- b2st replied Apr 13, 2012
good bye — Hey guys, I guess this will be my last post on this thread. Not much active interest from others to revive this discussion and at same time, I'm probably doing something quite different from what you would like to see on "standard" ...
M&W-Trading