- Search Forex Factory

- Simplified original turtle trading systemStarted Mar 25, 2011|Trading Systems|42 replies
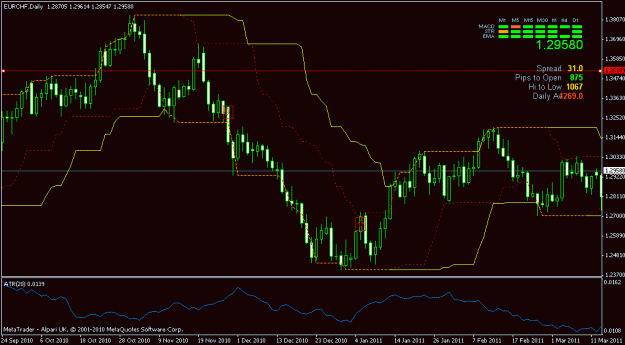
The story of the commodity trading Turtles has become one of the most famous in trading history. ...
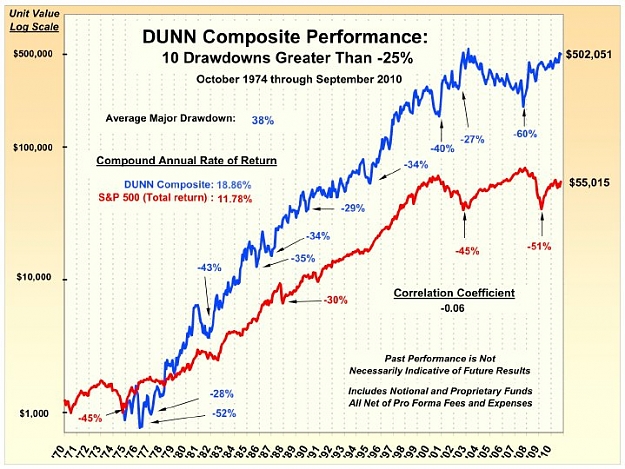
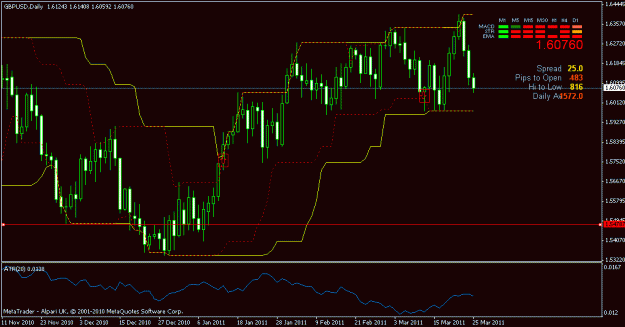
The story of the commodity trading Turtles has become one of the most famous in trading history. ...