- Search Forex Factory
- 706 Results
-
 TheArcher replied Dec 20, 2013
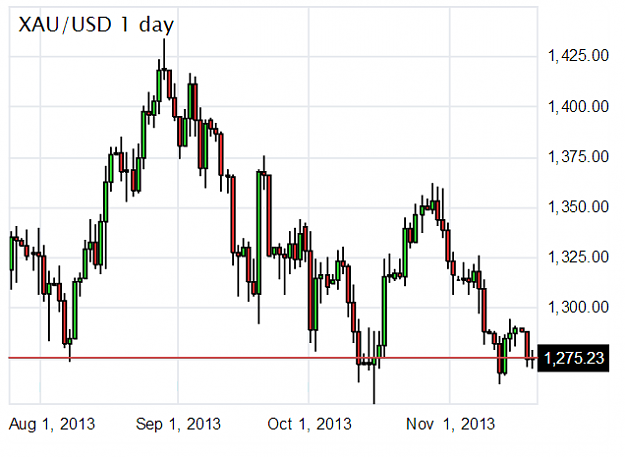
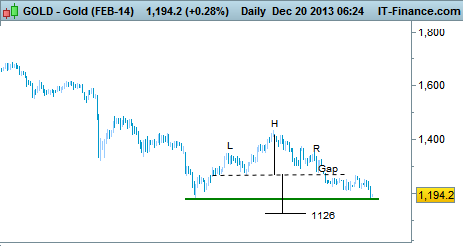
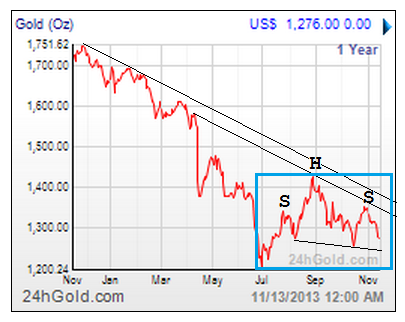
neat chart something new to me : Three Buddha or west H&S : what does it say ? but at the same time , will it turn out to be a double bottom ?
XAU/USD & XAG/USD - Gold & Silver Traders Thread
- TheArcher replied Dec 19, 2013
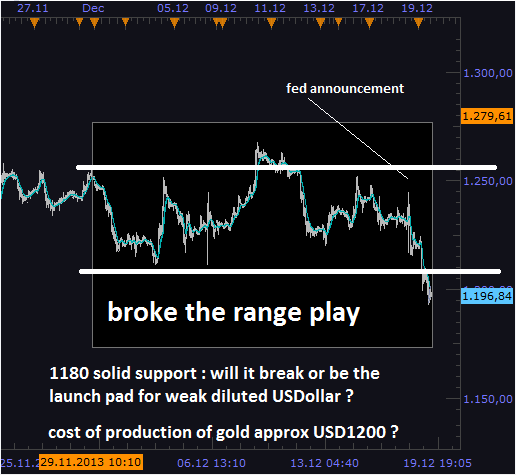
Gracias ! and what did FED say ? what are the long term implications of Ben's speech , if any ?
XAU/USD & XAG/USD - Gold & Silver Traders Thread
- TheArcher replied Nov 27, 2013
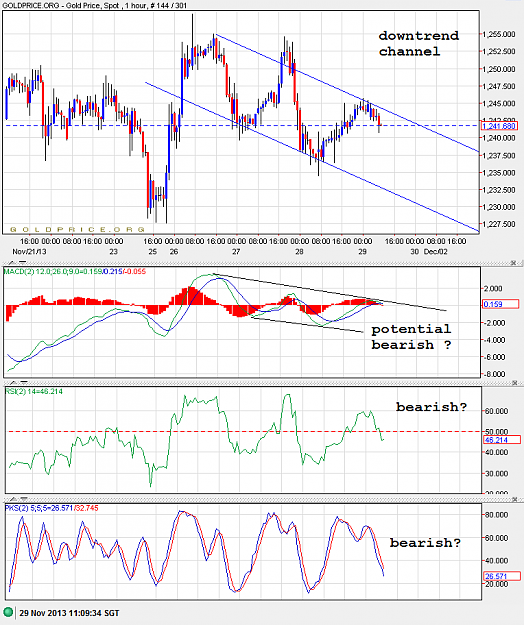
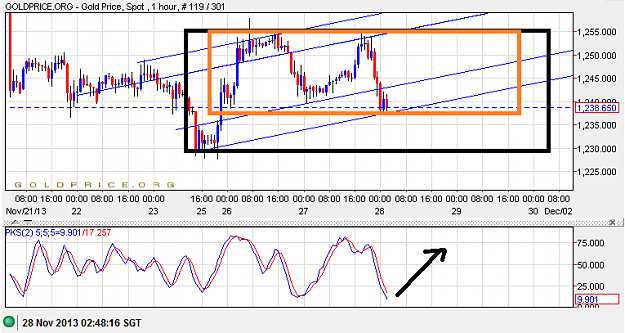
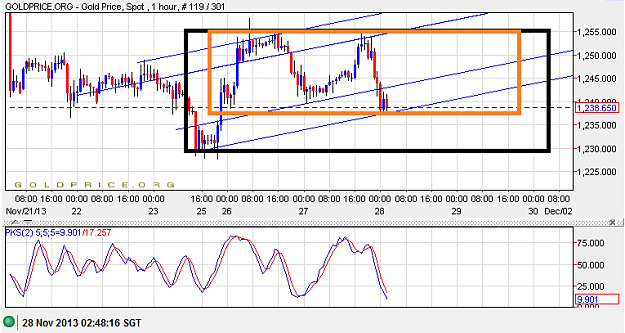
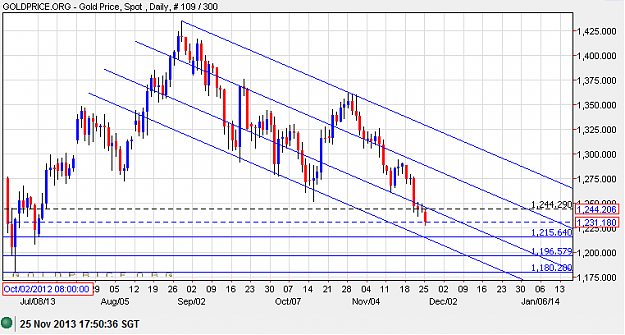
range play . stocs oversold .... rise ?
XAU/USD & XAG/USD - Gold & Silver Traders Thread
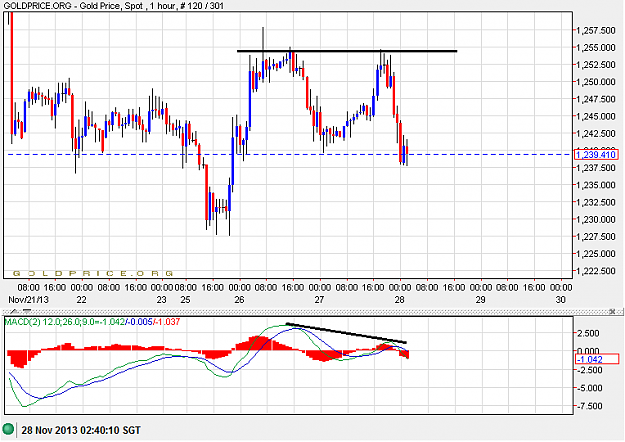
- TheArcher replied Nov 27, 2013
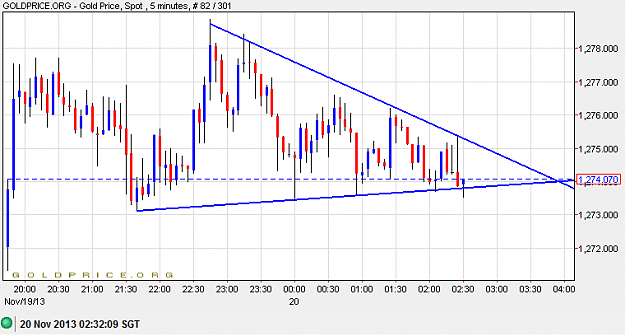
nice divergence play
XAU/USD & XAG/USD - Gold & Silver Traders Thread
- TheArcher replied Nov 27, 2013
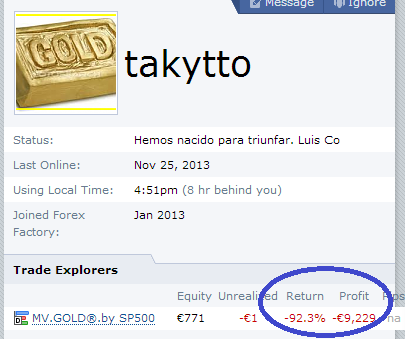
gemy and LaLinea . you are the greatest ! you are the most sane people in here !! we all love you !!! keep posting your price targets ! we just love them !!! the last time, we had one takytto and he was great too ! he had even started his own thread ...
XAU/USD & XAG/USD - Gold & Silver Traders Thread
- TheArcher replied Nov 25, 2013
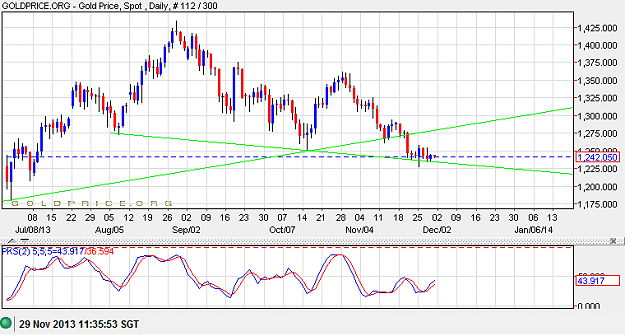
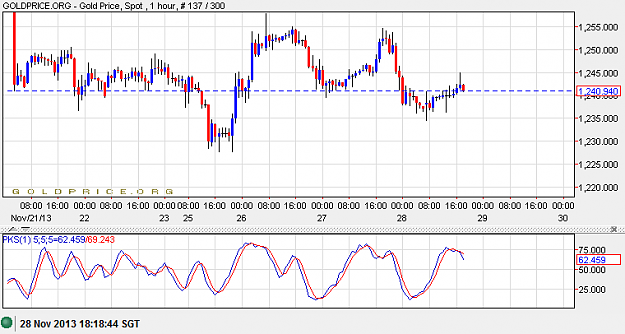
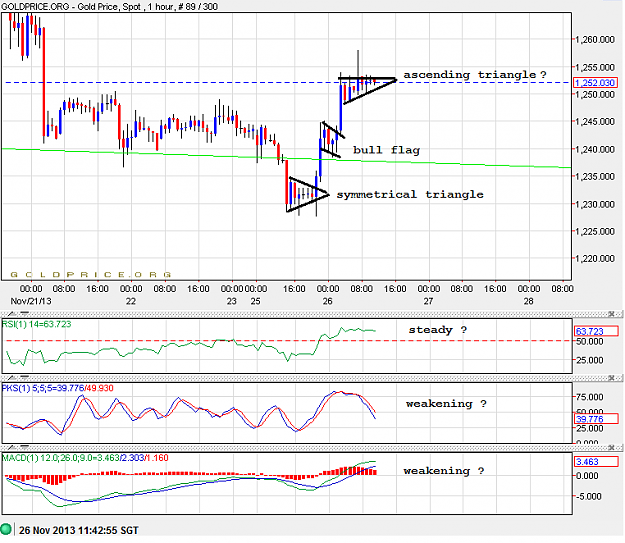
what is the PA saying ?
XAU/USD & XAG/USD - Gold & Silver Traders Thread
- TheArcher replied Nov 25, 2013
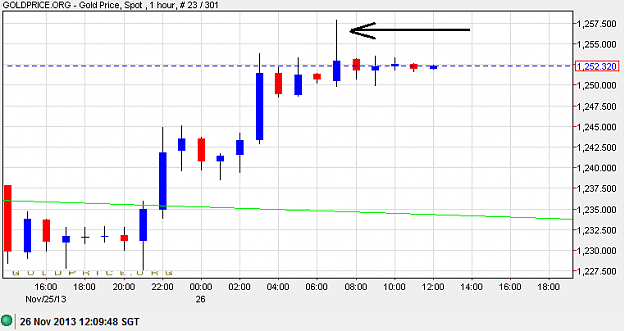
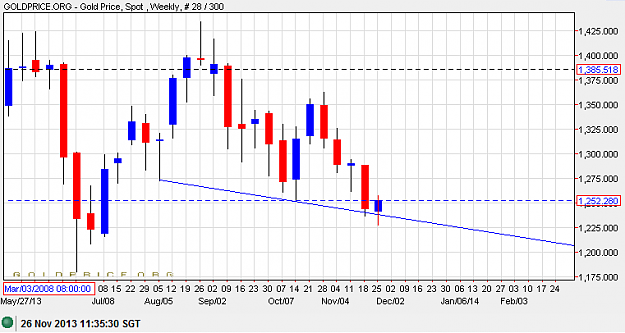
many things are zig zagging in my mind .... Iran becomes friendly with no to nuclear ... less geopolitical tension ...therefore oil price drop .... will gold drop too ? what the charts are saying ?
XAU/USD & XAG/USD - Gold & Silver Traders Thread
- TheArcher replied Nov 24, 2013
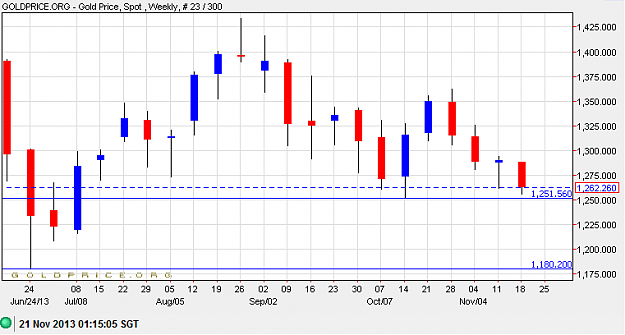
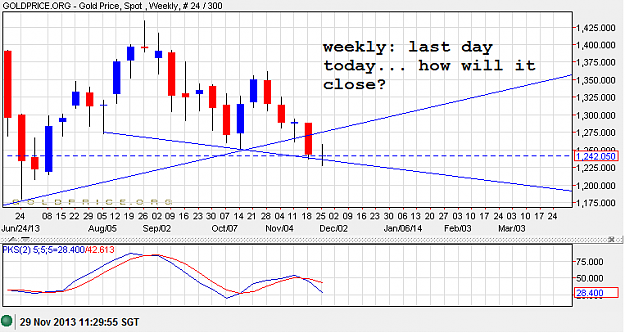
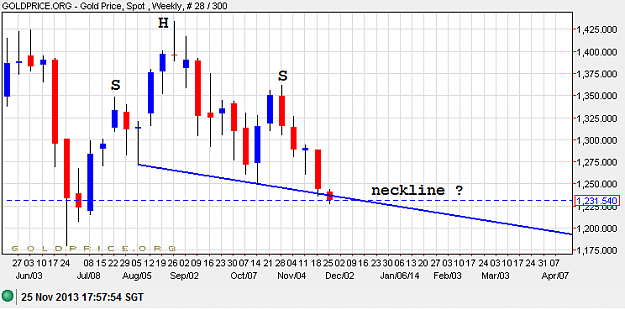
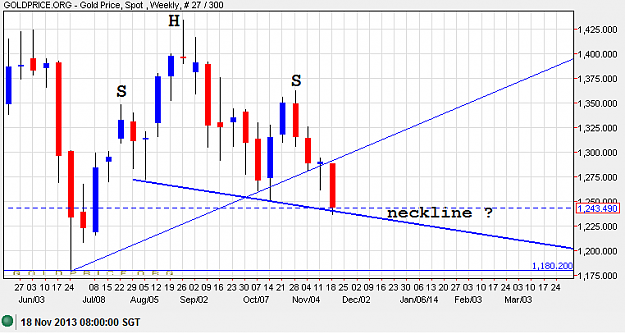
i am not sure if we are on the same wavelenght comparing apple with apple or orange with orange .... what is the time frame of your chart ? mine is a weekly chart based, what's yours ? i am talking of H & S and u are talking of Inverse H & S . i am ...
XAU/USD & XAG/USD - Gold & Silver Traders Thread
- TheArcher replied Nov 24, 2013
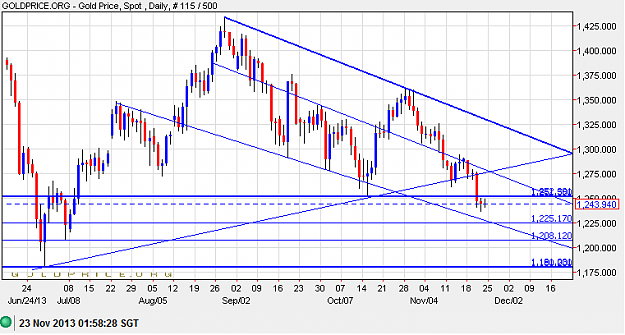
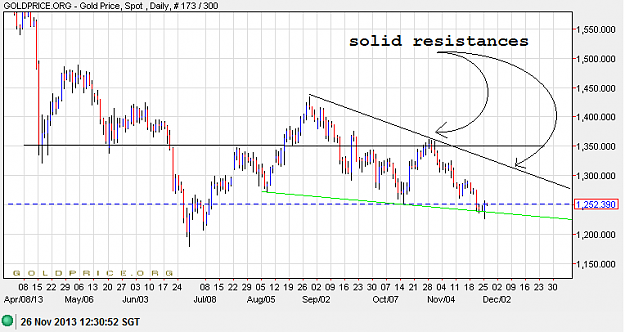
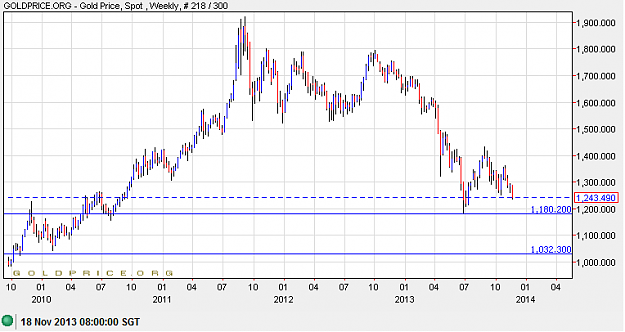
weekly charts 1) if indeed H&S , testing time at neckline 2) if bear all the way ... supports at 1180 , then 1100 , last stop at 1030 ?
XAU/USD & XAG/USD - Gold & Silver Traders Thread
- TheArcher replied Nov 22, 2013
mighty reversal signal ? H & S ?
XAU/USD & XAG/USD - Gold & Silver Traders Thread
- TheArcher replied Nov 22, 2013
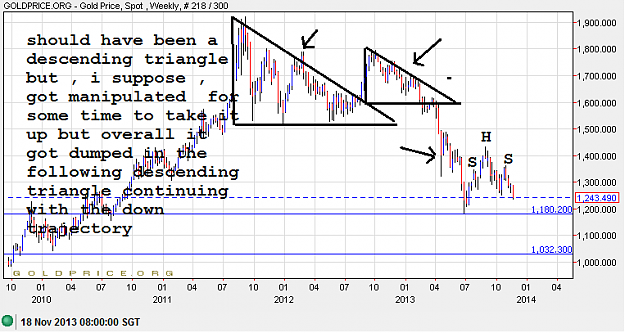
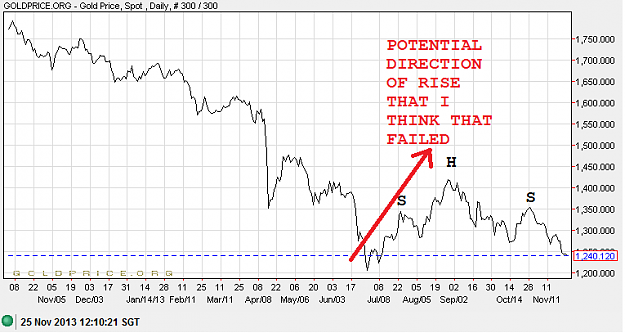
I suppose , if they have made up their mind to create a double bottom pattern , then 1180 is the last stop before the rally . on the other hand , if they have decided they have finished fleeceing the market by jacking up price and later dumping them ...
XAU/USD & XAG/USD - Gold & Silver Traders Thread