- Search Forex Factory
- 38 Results
-
 Solomon1a replied Oct 26, 2015
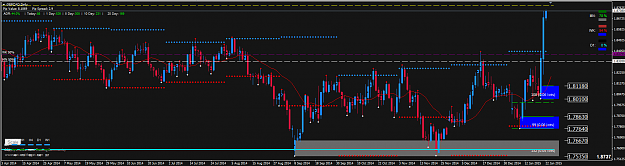
Hello Alnfonso, I am little confused with weekly TL of dollar index. is this a right TL now, attached below: image
Supply and demand in a nutshell by Alfonso Moreno
- Solomon1a replied Sep 20, 2015
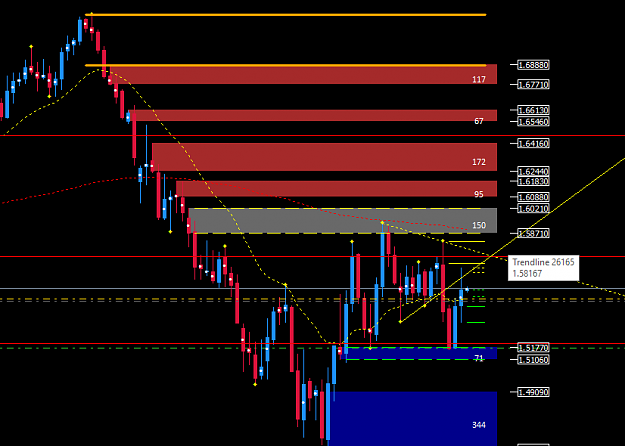
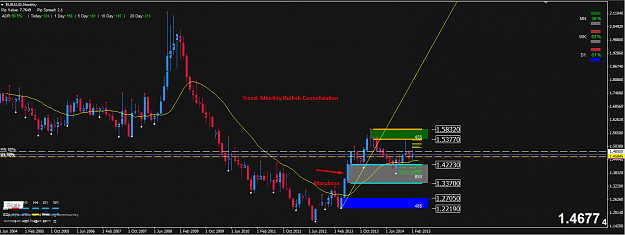
I have one confusion about GBPUSD weekly TL, which one is the right TL, the bold one or the dotted one? image
Supply and demand in a nutshell by Alfonso Moreno
- Solomon1a replied Sep 20, 2015
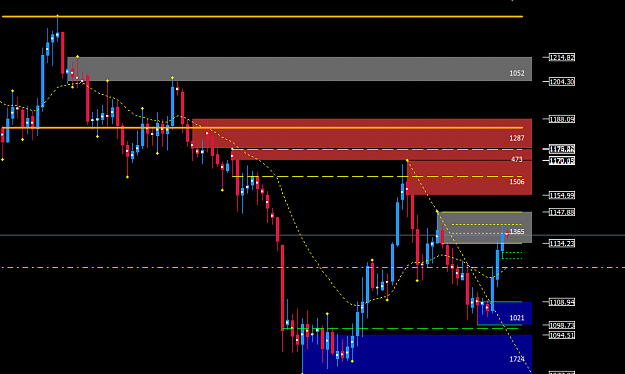
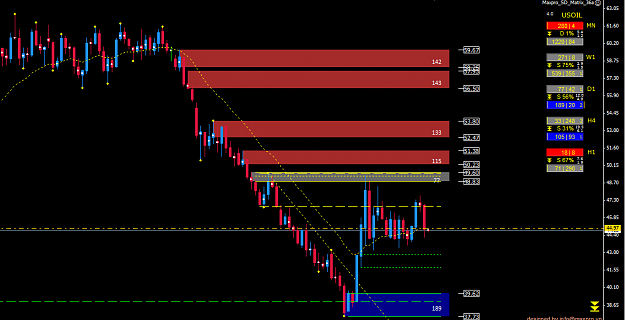
GOLD Daily, Will drop from here. image Oil Daily, Already start dropping. image Shorting oil is good, but long on gold is risk imo.
EURUSD
- Solomon1a replied Aug 21, 2015
Hello alfonso, is it time to buy dow us30? its in a monthly demand with nested weekly demand and monthly trendline consensus image
Supply and demand in a nutshell by Alfonso Moreno
- Solomon1a replied Aug 18, 2015
you must concentrate what is in the attach picture. its simple if you read it with full concentration. image
Supply and demand in a nutshell by Alfonso Moreno
- Solomon1a replied May 10, 2015
Hello, Alfonso first of all thanks for sharing your experience and hard work with us. I'm still learning your supply and demand rules and testing my learning. and after a 7 months of learning i am getting positive results. i dont know if it is ...
Supply and demand in a nutshell by Alfonso Moreno
- Solomon1a replied Apr 19, 2015
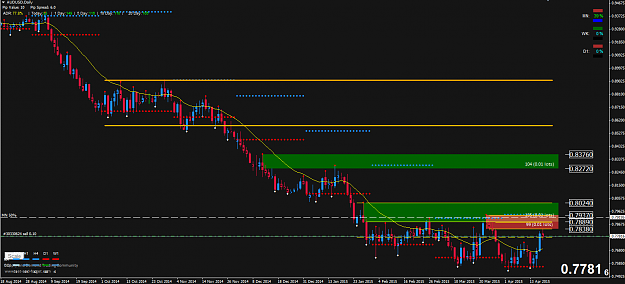
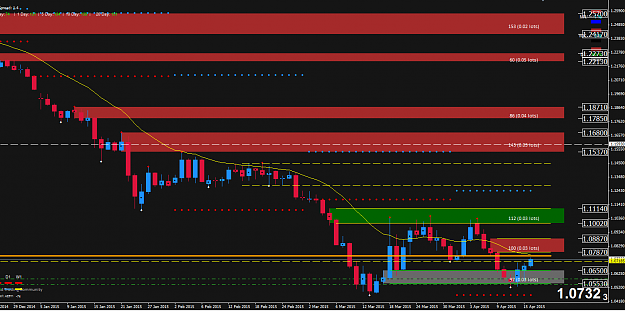
hello all and alfonso, I shorted audusd, monthly , weekly, down and now we are in daily fresh supply zone, which is nested with weekly supply zone. image
Supply and demand in a nutshell by Alfonso Moreno
- Solomon1a replied Apr 15, 2015
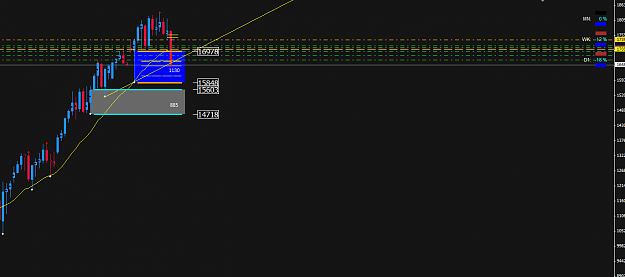
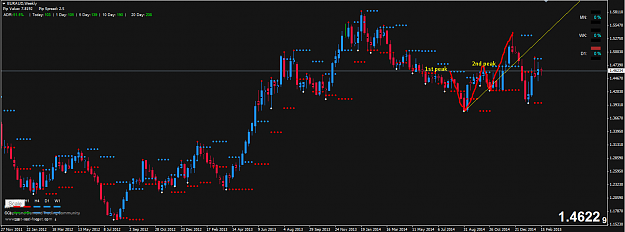
hello alfonso, i bought eu at last h4 demand, but here is one confusion with d1 demand and supply, look at the picture below, is that a valid supply? and we have 2 peaks so its a clear downtrend. image
Supply and demand in a nutshell by Alfonso Moreno
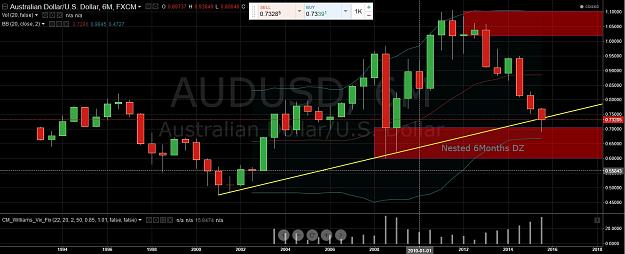
- Solomon1a replied Feb 25, 2015
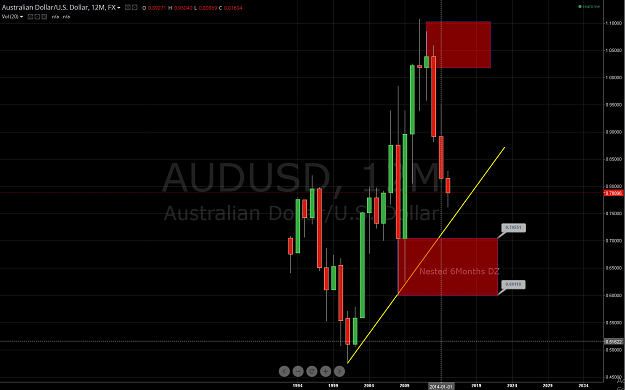
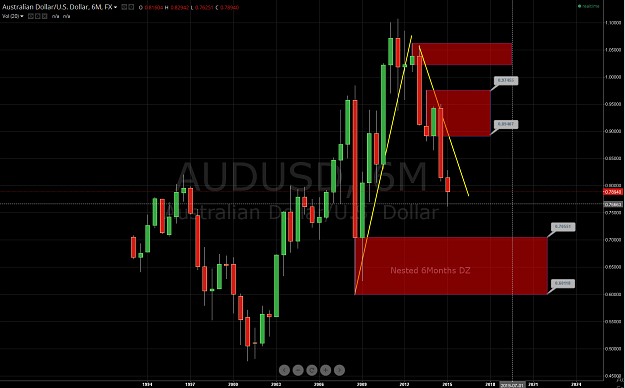
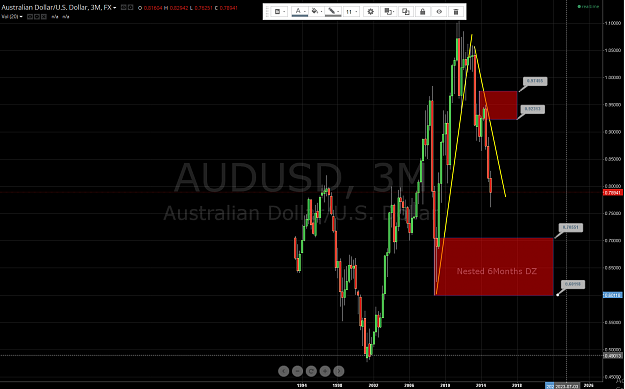
AUDUSD is on potential sell, below is the long term report/analysis of audusd. 1-Year still UP image 6 Months out of align and down. image 3 Months also down and out of align. image All the trends are down, except 1year, and the 0.7055 is the ...
Supply and demand in a nutshell by Alfonso Moreno
- Solomon1a replied Feb 25, 2015
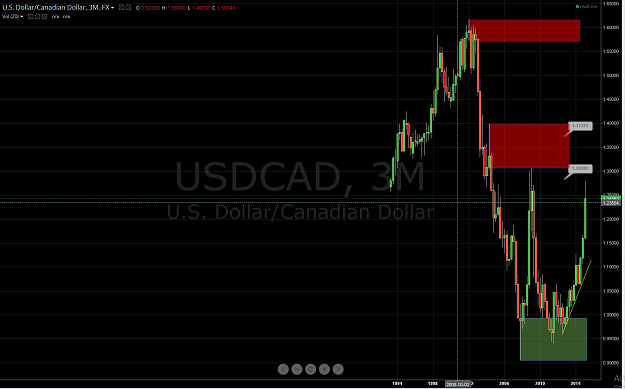
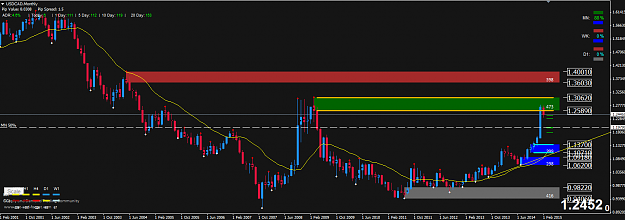
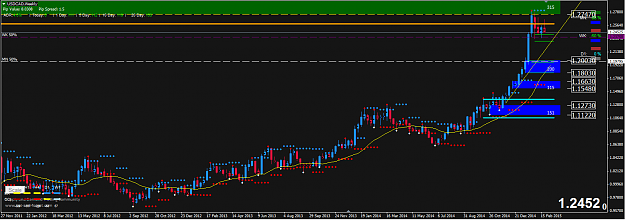
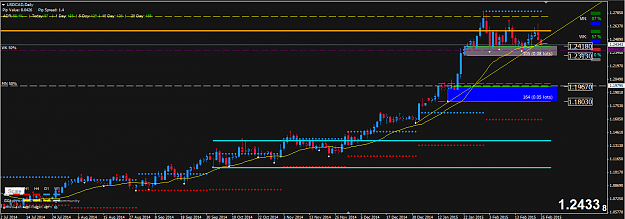
Hello Alfonso and fellow traders, hope everyone is doing great, here is my USDCAD top down analysis. 3 Months: is up with very strong bullish momentum image 1 Month: is up and currently reacting to monthly SZ which is in control. image Weekly: ...
Supply and demand in a nutshell by Alfonso Moreno
- Solomon1a replied Feb 17, 2015
You are right that candlestick is not marubuzo. so thats not a demand. about weekly chart, we have two peaks. can you show me where it took out 2 DZ? Weekly: image
Supply and demand in a nutshell by Alfonso Moreno
- Solomon1a replied Feb 15, 2015
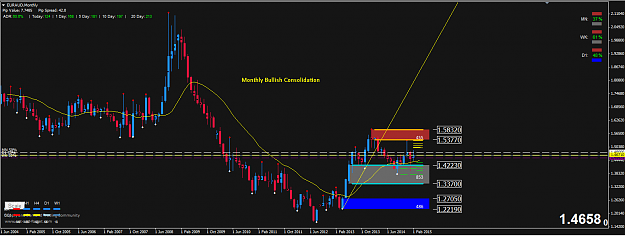
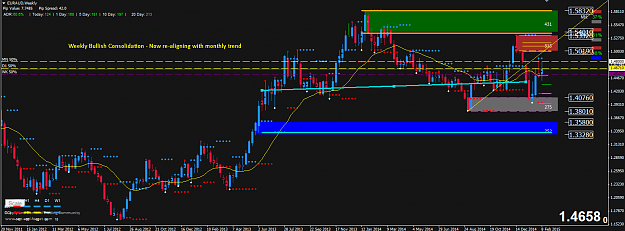
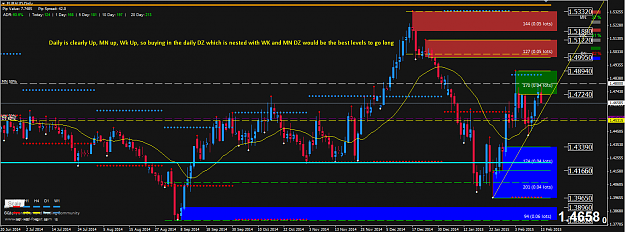
Monhtly = Bullish consolidation Weekly Bullish consolidation and re-aligning with monthly Daily = Clearly Up So long is the bias. Best area to buy euraud would be the nested MN and WK and D! DZ. Monthly: image Weekly: image Daily: image
Supply and demand in a nutshell by Alfonso Moreno
- Solomon1a replied Feb 13, 2015
EURAUD Monthly: image
Supply and demand in a nutshell by Alfonso Moreno
- Solomon1a replied Jan 22, 2015
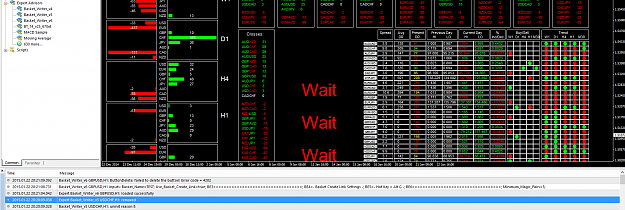
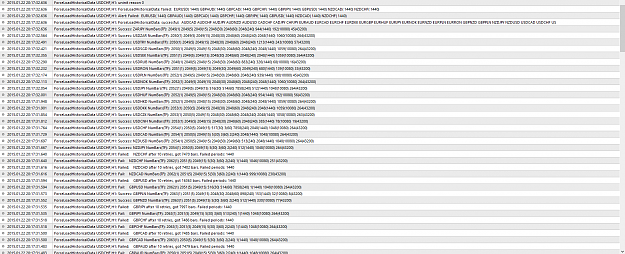
what is this error about? i am trying to add basket writer v6, i have few errors in image i had this error also while loading historical data image
Basket Trading EA
- Solomon1a replied Jan 22, 2015
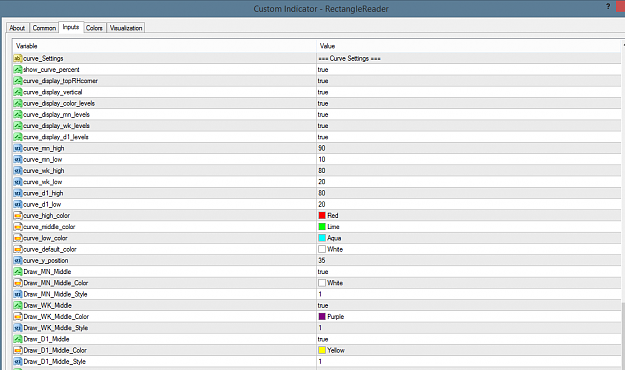
Hello, Alfonso I am having some problem with rectangle reader, Daily 50% line not showing up and also its not showing the % in curve, even settings are on in the indicator. below are the pictures. image image
Supply and demand in a nutshell by Alfonso Moreno
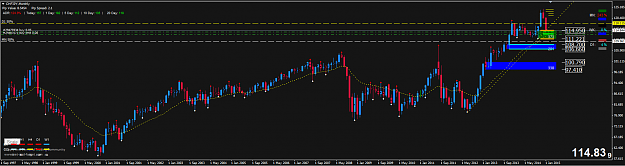
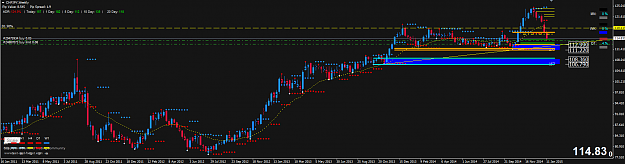
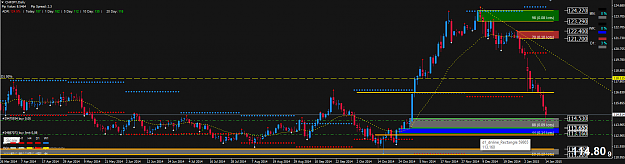
- Solomon1a replied Jan 14, 2015
Hello traders and alfonso, This is my chfjpy analysis Monthly is UP Weekly is UP Daily is Down (MN/WK nested demand zone) Monthly: image Weekly: image Daily: image
Supply and demand in a nutshell by Alfonso Moreno
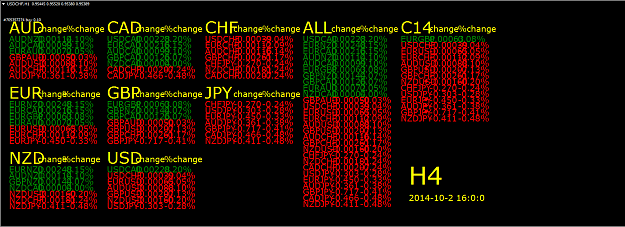
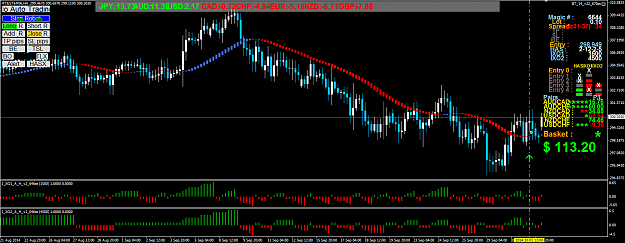
- Solomon1a replied Oct 2, 2014
nice indicator bro, i am using it but my chart looks messy, can you help me in this regard? image
Basket Trading EA