- Search Forex Factory
- 374 Results
-
 SimpleDev replied Jul 14, 2015
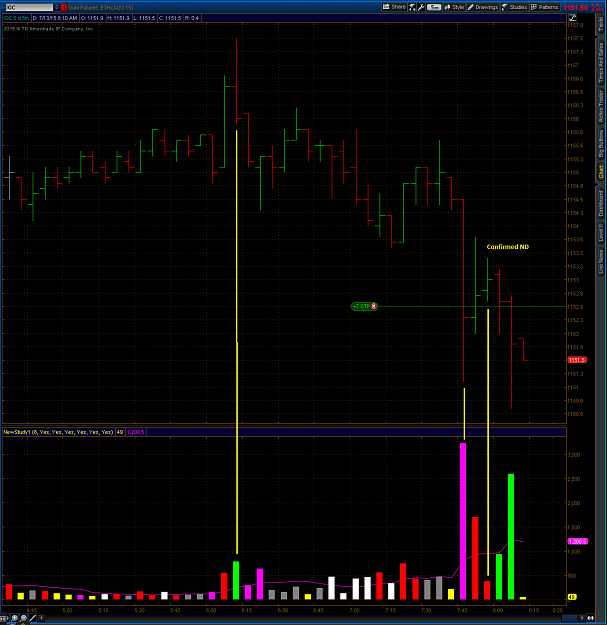
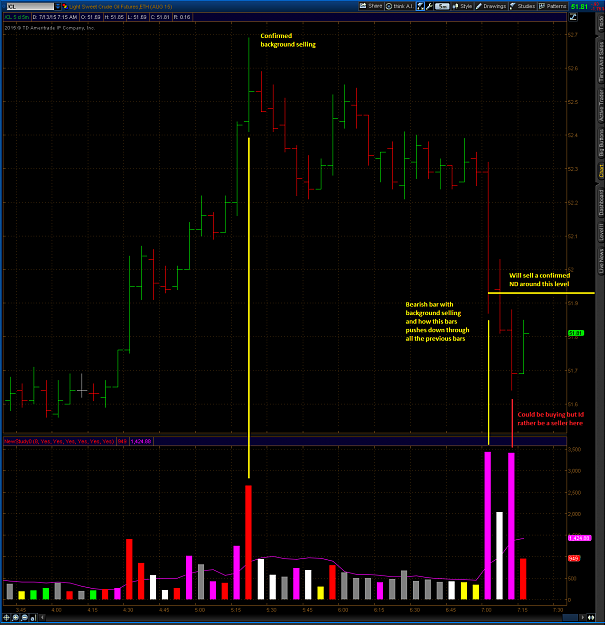
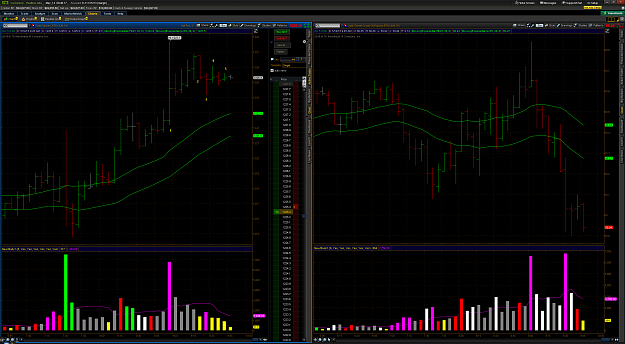
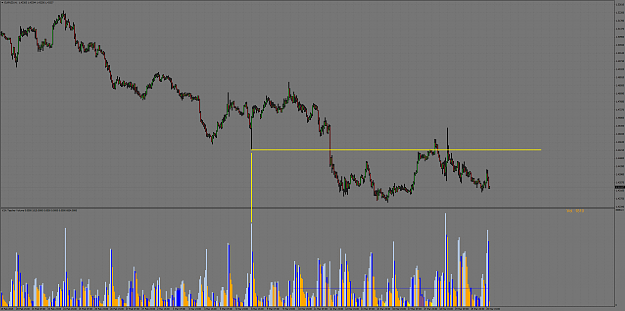
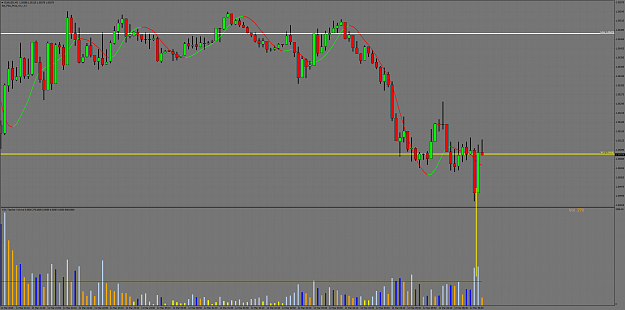
Oil Futures chart.. No trades that I would want to be in on this chart, just showing thought process.
vsa with Malcolm
- SimpleDev replied Jul 13, 2015
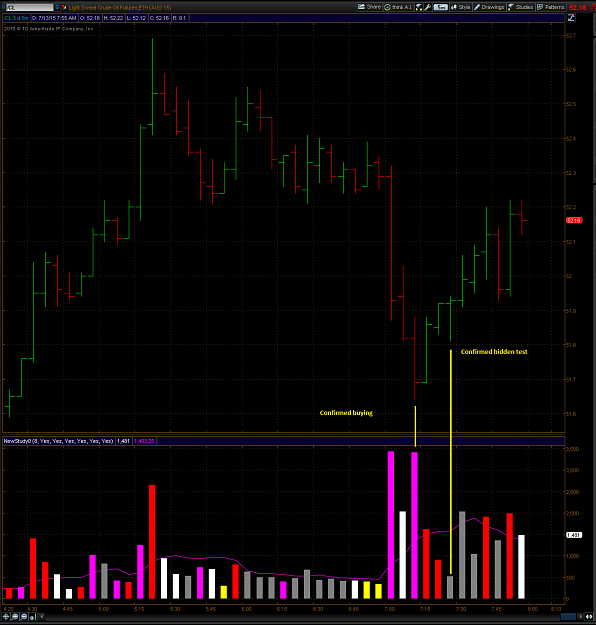
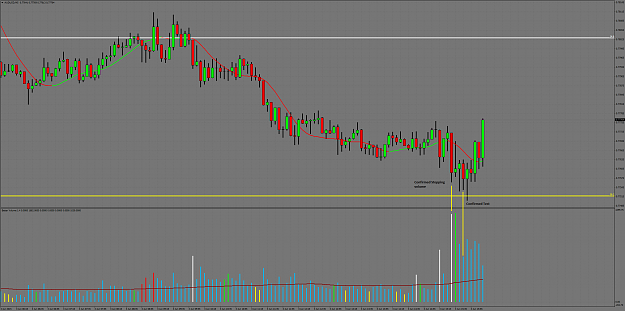
Didnt trade this I wasnt prepared for a rally. But the VSA setup was there.
vsa with Malcolm
- SimpleDev replied Jul 13, 2015
Just my view on your question, hopefully HG still posts his response. Actual charts are easier to explain and general questions like these are difficult to answer. But from what I gather from your question if the market is trending down, IE making ...
vsa with Malcolm
- SimpleDev replied Jun 3, 2015
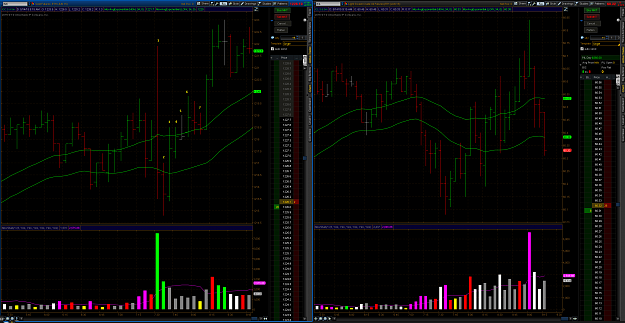
Didnt trade either of these, I focus on gold/oil futures these days. But 2 great setups on UJ and both essentially the same setup. Red setup with confirmed stopping volume then followed by a confirmed hidden test. Yellow is exactly the same ...
vsa with Malcolm
- SimpleDev replied Jun 2, 2015
A lot of differences, like I said you have to be really careful.
vsa with Malcolm
- SimpleDev replied Jun 2, 2015
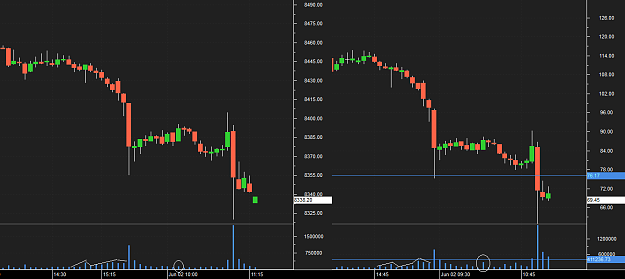
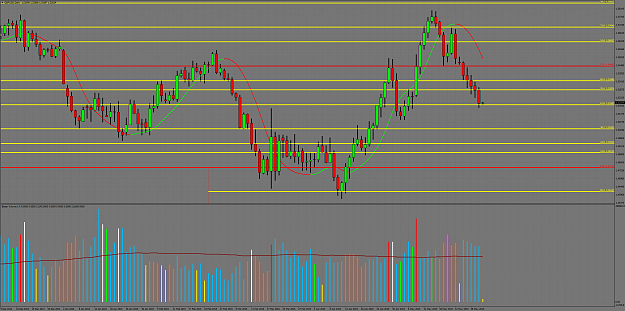
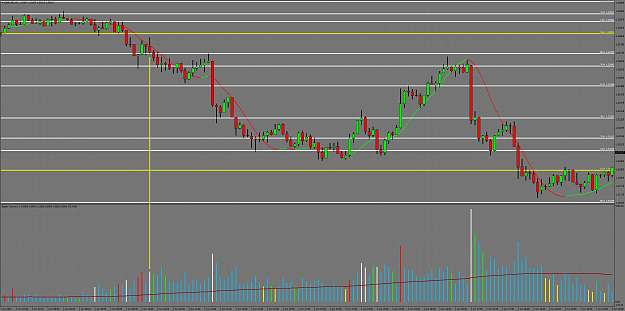
I am assuming you are looking at different contracts? The first 2 screen shots say NIFTY15JUN8500CE, the 3rd one says NIFTY15JUNFUT. The volume on 8500CE looks good. The FUT is bad. The bar I marked in yellow is the tip off. You had stopping volume, ...
vsa with Malcolm
- SimpleDev replied Jun 1, 2015
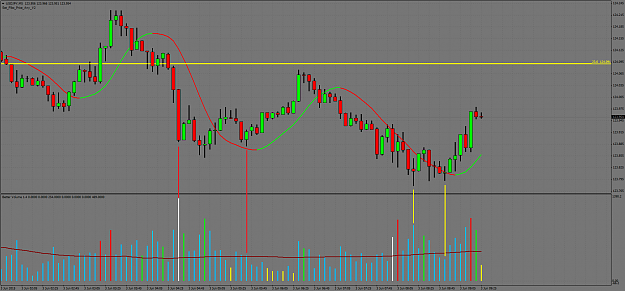
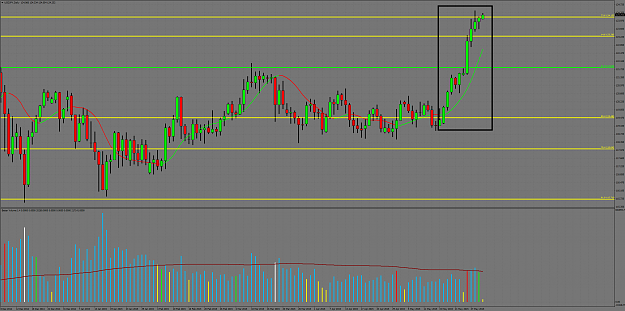
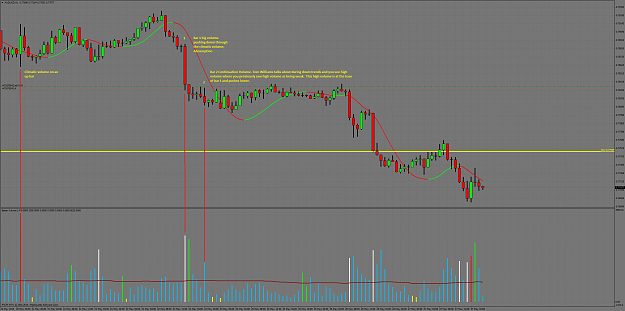
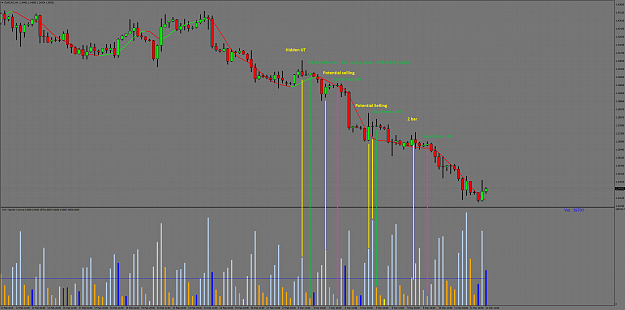
You have to love these trending markets. Look at daily of GU, lower lows and lower highs. 5m chart, 10 minutes after LO. Hulls is down, this high volume bars tries to go above the previous bar but fails and closes on the low. The next bars closes ...
vsa with Malcolm
- SimpleDev replied May 31, 2015
For the most part you are on the right track.. But, look at this daily chart. Do you see how just about every bar since May 15th is making a higher high and a higher low? Now go back to your possible short entries on 1h and see if you still want to ...
vsa with Malcolm
- SimpleDev replied May 28, 2015
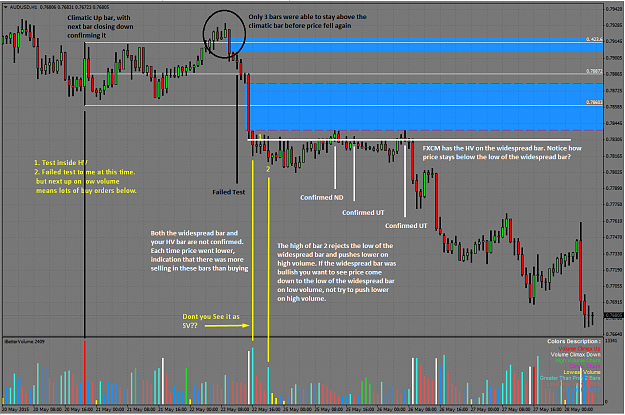
You have to watch and see how price reacts to SOS/SOW. Does the next bar confirm the SOS? Is price staying above or below the SOS? Are the test succeeding or failing? Is price trending up? Down? Or sideways? That AU chart has a SOW (described in ...
vsa with Malcolm
- SimpleDev replied May 27, 2015
Nice AU charts with examples of absorption volume. image AJ chart, 98% sure I am going to lose this trade. Could have been avoided if I waited for the UT on daily to confirm. image
vsa with Malcolm
- SimpleDev replied May 14, 2015
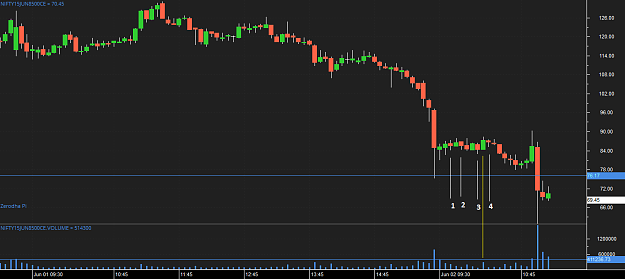
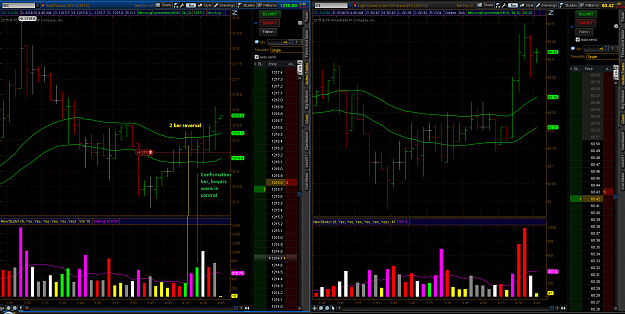
This is the last one.. 1: Stopping volume, next bar closes down confirming. 2: 2 bar reversal 3: Confirmation bar of the 2 bar, but it looks like a test. Probably good to stay out of a position. 4: Not a strong reaction to the test, next bar closes ...
vsa with Malcolm
- SimpleDev replied May 14, 2015
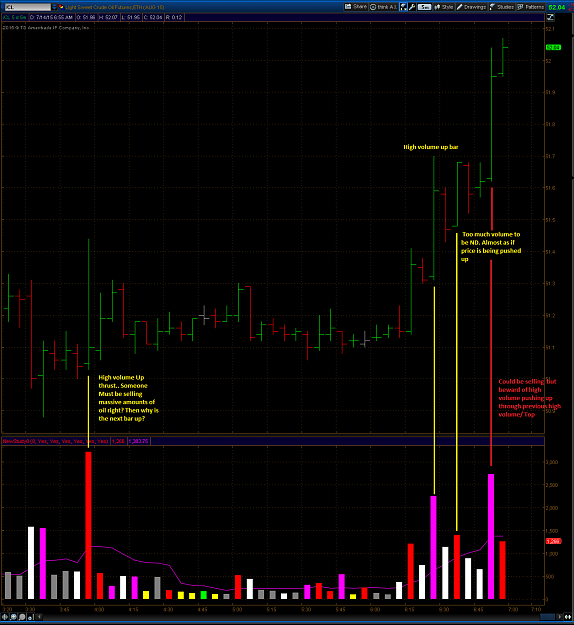
Been an awesome day for Gold. Bar 1: Massive wide spread and volume. This looks like huge amounts of selling comes in with the tail at the top. Bar 2: Down bar after climatic volume. I shorted the close of this bar. Bar 3: This bar immediately stops ...
vsa with Malcolm
- SimpleDev replied May 14, 2015
Excuse me Professor Gap, IMO your lessons on confirmation bars are one of the most important things taught on this thread, and probably the least emphasized. Perhaps in the future you could throw some reminders at us? Just a quick chart on gold ...
vsa with Malcolm
- SimpleDev replied Mar 20, 2015
Just thought I would throw out my opinion.. 4h is an odd timeframe and you do seem to be doing well with it. I would just say that you may want to consider adding 1h TF into your tool box. Take a look at 1h from March 6th. Massive volume there that ...
vsa with Malcolm
- SimpleDev replied Mar 12, 2015
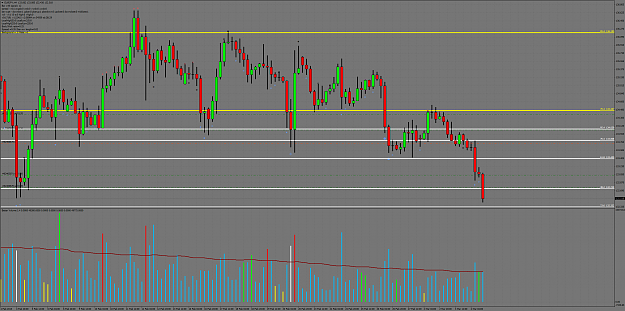
I would have entered in once the ND bars were confirmed. I didnt have time to highlight them, but looking at this chart you will notice there were days in the down move where it looks like strength is coming in. On those days there are NS bars ...
vsa with Malcolm
- SimpleDev replied Mar 12, 2015
Unfortunately I have to go to sleep, but a nice 2 bar reversal into major support.. All you need now is a test in a rising market.
vsa with Malcolm

- SimpleDev replied Mar 9, 2015
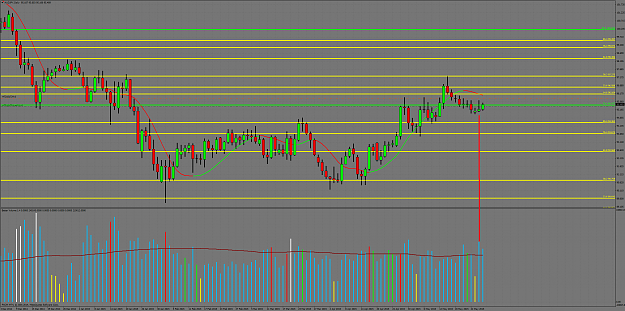
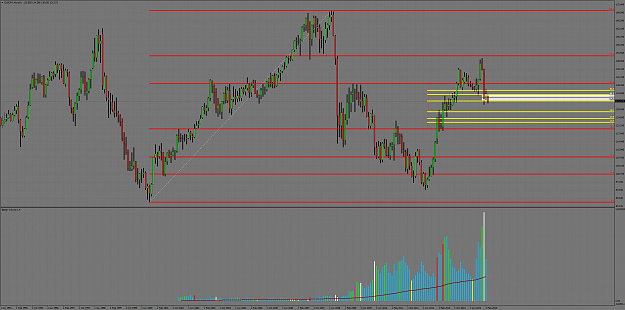
Yes I am using Fibs for S/R. I stole the idea from another thread, except I dont use his benchmarks. I use his fib levels and how he draws fibs inside fibs. url The original Fib (red) I drew using a swing high/low from monthly chart, then from the ...
vsa with Malcolm
- SimpleDev replied Mar 4, 2015
The idea behind Effort to Fall is there is a lack of sellers. In MTM Tom talks about you want to see expanding volume for a move to sustain itself, I don't use Effort to Fall in my trading. My advice is to learn to identify stopping volume and ...
vsa with Malcolm